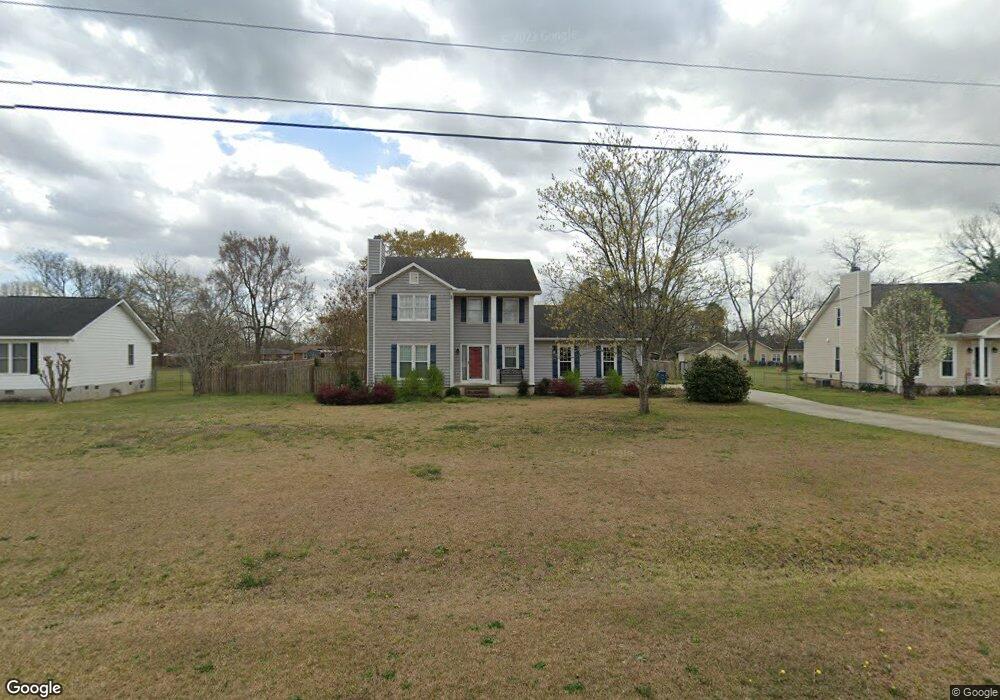
3692 Dean Dr Macon, GA 31216
Estimated Value: $238,446 - $284,000
3
Beds
2
Baths
1,532
Sq Ft
$166/Sq Ft
Est. Value
About This Home
This home is located at 3692 Dean Dr, Macon, GA 31216 and is currently estimated at $253,612, approximately $165 per square foot. 3692 Dean Dr is a home located in Bibb County with nearby schools including Porter Elementary School, Rutland Middle School, and Rutland High School.
Ownership History
Date
Name
Owned For
Owner Type
Purchase Details
Closed on
Nov 3, 2011
Sold by
Rossman Oswald Robin E
Bought by
Barber Elizabeth L
Current Estimated Value
Purchase Details
Closed on
Jul 17, 2006
Sold by
Hollomon Pamela Fka Mcentee Pamela W
Bought by
Barber Elizabeth
Home Financials for this Owner
Home Financials are based on the most recent Mortgage that was taken out on this home.
Original Mortgage
$122,550
Interest Rate
6.6%
Mortgage Type
New Conventional
Purchase Details
Closed on
Aug 25, 2003
Purchase Details
Closed on
Oct 30, 2001
Create a Home Valuation Report for This Property
The Home Valuation Report is an in-depth analysis detailing your home's value as well as a comparison with similar homes in the area
Purchase History
| Date | Buyer | Sale Price | Title Company |
|---|---|---|---|
| Barber Elizabeth L | $14,000 | None Available | |
| Barber Elizabeth | $129,000 | -- | |
| -- | $115,000 | -- | |
| -- | $111,000 | -- |
Source: Public Records
Mortgage History
| Date | Status | Borrower | Loan Amount |
|---|---|---|---|
| Previous Owner | Barber Elizabeth | $122,550 |
Source: Public Records
Tax History
| Year | Tax Paid | Tax Assessment Tax Assessment Total Assessment is a certain percentage of the fair market value that is determined by local assessors to be the total taxable value of land and additions on the property. | Land | Improvement |
|---|---|---|---|---|
| 2025 | $1,791 | $79,896 | $14,000 | $65,896 |
| 2024 | $1,834 | $79,200 | $14,000 | $65,200 |
| 2023 | $1,078 | $67,442 | $14,000 | $53,442 |
| 2022 | $1,938 | $62,982 | $10,328 | $52,654 |
| 2021 | $1,817 | $54,803 | $8,679 | $46,124 |
| 2020 | $1,695 | $50,669 | $7,811 | $42,858 |
| 2019 | $1,596 | $47,761 | $6,943 | $40,818 |
| 2018 | $2,397 | $43,975 | $6,943 | $37,032 |
| 2017 | $1,325 | $42,363 | $7,280 | $35,083 |
| 2016 | $1,223 | $42,363 | $7,280 | $35,083 |
| 2015 | $1,431 | $36,208 | $7,280 | $28,928 |
| 2014 | $1,776 | $36,208 | $7,280 | $28,928 |
Source: Public Records
Map
Nearby Homes
- 3720 Dean Dr
- 3708 Jones Rd
- 308 Ellis Ct
- 3491 Sandy Cir
- 6670 Fran Dr
- 405 Stonecrest Ct
- 5608 Swymer Dr
- 123 Hudson Way
- 813 Ocala National Trail
- 6045 Cara Dr
- 106 Hudson Way
- 3150 Holleman Dr
- 3290 Bridgewood Dr
- 3533 Bridgewood Dr
- 3906 Hartley Bridge Rd
- 3636 Bonanza Dr
- 201 Liberty Trace
- 6414 Ponderosa Dr
- 109 Oakview Club Dr
- 4202 Cyndy Jo Cir
- 3696 Dean Dr
- 3688 Dean Dr
- 3683 Jones Rd
- 3693 Jones Rd
- 3673 Jones Rd
- 3700 Dean Dr
- 3684 Dean Dr
- 3691 Dean Dr Unit 61
- 3691 Dean Dr
- 3697 Dean Dr
- 3703 Jones Rd
- 3685 Dean Dr
- 151 Stonefield Cir
- 5894 Angela Place
- 3663 Jones Rd
- 155 Stonefield Cir
- 3723 Jones Rd
- 139 Stonefield Cir
- 3672 Jones Rd
- 146 Stonefield Cir
Your Personal Tour Guide
Ask me questions while you tour the home.