NOT LISTED FOR SALE

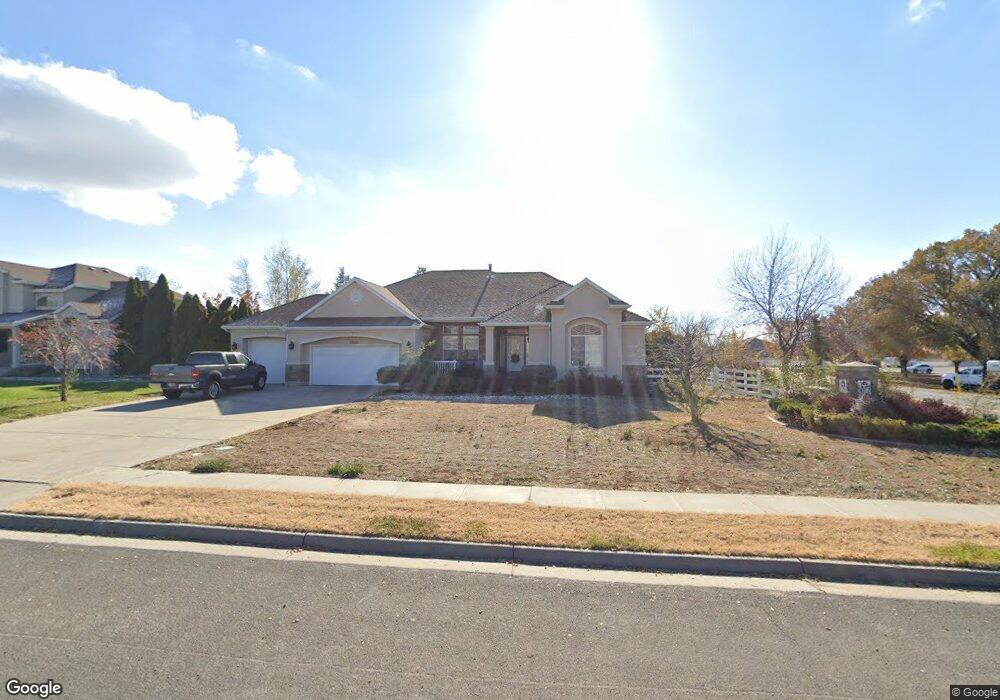
3693 W Gordon Ave Layton, UT 84041

Estimated Value: $641,000 - $879,000

3 Beds
3 Baths
4,859 Sq Ft
$157/Sq Ft Est. Value

About This Home

This home is located at 3693 W Gordon Ave, Layton, UT 84041 and is currently estimated at $762,285, approximately $156 per square foot. 3693 W Gordon Ave is a home located in Davis County with nearby schools including Sand Springs Elementary School, Legacy Junior High School, and Layton High School.

Ownership History

Date Name Owned For Owner Type

Purchase Details

Closed on
Aug 5, 2024
Sold by
Lenaburg Ashley M
Bought by
Layton City
Current Estimated Value
$762,285

Purchase Details

Closed on
Jan 11, 2022
Sold by
Lenaburg Ashley M and Lenaburg Ashley
Bought by
Lenaburg Ashley M

Home Financials for this Owner

Home Financials are based on the most recent Mortgage that was taken out on this home.
Original Mortgage
$367,000
Interest Rate
3.05%
Mortgage Type
New Conventional

Purchase Details

Closed on
May 26, 2017
Sold by
Stark Erin Tyler
Bought by
Lenaburg Ashley M

Home Financials for this Owner

Home Financials are based on the most recent Mortgage that was taken out on this home.
Original Mortgage
$389,436
Interest Rate
3.87%
Mortgage Type
FHA

Purchase Details

Closed on
Oct 3, 2005
Sold by
Ivory Homes Ltd
Bought by
Hill Harold E and Hill Kay W
Source: Public Records

Range of Values:

Collateral Analytics

Collateral Analytics Collateral Analytics AVMs (Automated Valuation Model) employ a number of statistical approaches combined with neighborhood-specific comparable selection guarantees the most up-to-date and precise valuations.

Not Available

Collateral Analytics does not have data for the current month. Please view the chart for historical values.

ICE

ICE Mortgage Technology ICE Mortgage Technology’s AVM (Automated Valuation Model) is a state-of-the-art online residential property valuation tool that provides a quick and accurate estimate of the value of almost any home in the U.S.

Not Available

ICE Mortgage Technology does not have data for the current month. Please view the chart for historical values.

First American

First American First American Data & Analytics’ next-generation AVM combines unrivaled data assets with a blended ensemble of valuation models to produce highly accurate, reliable valuations you can trust.

Not Available

First American does not have data for the current month. Please view the chart for historical values.

Quantarium

Quantarium Quantarium’s valuation service, repeatedly proven the industry’s most accurate and comprehensive, is supercharged with a self-learning and auto-tuning AI engine that continually becomes smarter and more accurate as it processes daily inputs from the industry’s leading RE data lake.

Not Available

Quantarium does not have data for the current month. Please view the chart for historical values.

Average Value
Not Available
List Price
Sold Price
Create a Home Valuation Report for This Property
The Home Valuation Report is an in-depth analysis detailing your home's value as well as a comparison with similar homes in the area

Home Values in the Area

Source: Public Records

Average Home Value in this Area


Source: Public Records

Purchase History

Date Buyer Sale Price Title Company
Layton City -- Cottonwood Title
Lenaburg Ashley M -- Stewart Title Ins A
Lenaburg Ashley M -- First American Title
Hill Harold E -- Cottonwood Title Ins Agency
Source: Public Records

Mortgage History

Date Status Borrower Loan Amount
Previous Owner Lenaburg Ashley M $367,000
Previous Owner Lenaburg Ashley $80,000
Previous Owner Lenaburg Ashley $53,000
Previous Owner Lenaburg Ashley M $389,436
Source: Public Records

Tax History Compared to Growth

Source: Public Records

Tax History

Year Tax Paid Tax Assessment Tax Assessment Total Assessment is a certain percentage of the fair market value that is determined by local assessors to be the total taxable value of land and additions on the property. Land Improvement
2024 $3,537 $373,999 $151,028 $222,971
2023 $3,471 $355,850 $128,707 $227,142
2022 $3,663 $674,000 $208,676 $465,324
2021 $3,319 $501,000 $171,978 $329,022
2020 $2,997 $434,000 $152,548 $281,452
2019 $2,891 $410,000 $137,356 $272,644
2018 $2,865 $408,000 $122,484 $285,516
2016 $2,664 $195,690 $58,337 $137,353
2015 $2,727 $190,190 $58,337 $131,853
2014 $2,320 $165,419 $58,337 $107,082
2013 -- $160,012 $51,234 $108,778
Source: Public Records

Map