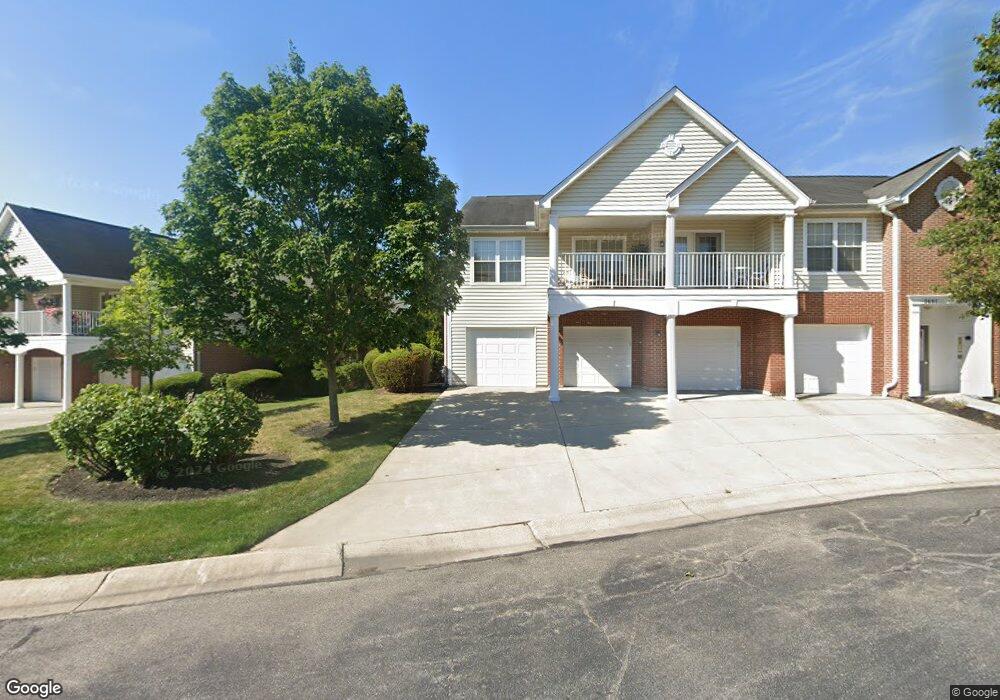
3696 Chestnut Park Unit LANE Cleves, OH 45002
Estimated Value: $215,000 - $232,236
3
Beds
2
Baths
1,382
Sq Ft
$161/Sq Ft
Est. Value
About This Home
This home is located at 3696 Chestnut Park Unit LANE, Cleves, OH 45002 and is currently estimated at $222,309, approximately $160 per square foot. 3696 Chestnut Park Unit LANE is a home located in Hamilton County with nearby schools including Charles T. Young Elementary School, Taylor Middle School, and Taylor High School.
Ownership History
Date
Name
Owned For
Owner Type
Purchase Details
Closed on
Jul 19, 2022
Sold by
Mock William V and Mock Sandra L
Bought by
Demaree Moira
Current Estimated Value
Purchase Details
Closed on
Jul 15, 2015
Sold by
Culman Randal E and Krall Alice
Bought by
Mock William and Mock Sandra L
Home Financials for this Owner
Home Financials are based on the most recent Mortgage that was taken out on this home.
Original Mortgage
$99,600
Interest Rate
4.05%
Mortgage Type
New Conventional
Purchase Details
Closed on
Jun 28, 2012
Sold by
Culman Donald E and Culman Judith
Bought by
Culman Randal E
Purchase Details
Closed on
Dec 28, 2010
Sold by
Miller Candice C and Larkins Candice C
Bought by
Culman Donald E
Purchase Details
Closed on
Apr 28, 2004
Sold by
Larkins Alan L
Bought by
Larkins Candice C
Purchase Details
Closed on
Sep 24, 2003
Sold by
Tdggc Llc
Bought by
Larkins Alan L and Larkins Candice C
Create a Home Valuation Report for This Property
The Home Valuation Report is an in-depth analysis detailing your home's value as well as a comparison with similar homes in the area
Home Values in the Area
Average Home Value in this Area
Purchase History
| Date | Buyer | Sale Price | Title Company |
|---|---|---|---|
| Demaree Moira | $200,000 | Northwest Title | |
| Mock William | $124,500 | Attorney | |
| Culman Randal E | -- | Attorney | |
| Culman Donald E | $114,500 | Attorney | |
| Larkins Candice C | -- | -- | |
| Larkins Alan L | $136,900 | -- |
Source: Public Records
Mortgage History
| Date | Status | Borrower | Loan Amount |
|---|---|---|---|
| Previous Owner | Mock William | $99,600 |
Source: Public Records
Tax History Compared to Growth
Tax History
| Year | Tax Paid | Tax Assessment Tax Assessment Total Assessment is a certain percentage of the fair market value that is determined by local assessors to be the total taxable value of land and additions on the property. | Land | Improvement |
|---|---|---|---|---|
| 2024 | $3,266 | $70,000 | $7,875 | $62,125 |
| 2023 | $3,269 | $70,000 | $7,875 | $62,125 |
| 2022 | $2,439 | $49,676 | $6,146 | $43,530 |
| 2021 | $2,364 | $49,676 | $6,146 | $43,530 |
| 2020 | $2,399 | $49,676 | $6,146 | $43,530 |
| 2019 | $2,202 | $43,575 | $5,390 | $38,185 |
| 2018 | $2,117 | $43,575 | $5,390 | $38,185 |
| 2017 | $1,979 | $43,575 | $5,390 | $38,185 |
| 2016 | $1,515 | $36,309 | $5,460 | $30,849 |
| 2015 | $2,035 | $36,309 | $5,460 | $30,849 |
| 2014 | $2,057 | $36,309 | $5,460 | $30,849 |
| 2013 | $2,580 | $46,550 | $7,000 | $39,550 |
Source: Public Records
Map
Nearby Homes
- 3693 Chestnut Park Ln
- 3596 Chestnut Park Ln
- 3600 Chestnut Park Ln
- 3594 Chestnut Park Ln
- 3736 Bremen Pass
- 3503 Chestnut Park Ln
- 3498 Chestnut Park Ln
- 3813 Beacon Woods Dr
- 3829 Legendary Ridge Ln
- 3894 Bremen Pass
- 3830 Nottingham Ct
- 3601 Chadwell Springs Ct
- 8735 Bridgetown Rd
- 8708 Quietwood Ln
- Chattanooga Plan at Indian Walk
- Rockford Plan at Indian Walk
- Carlisle Plan at Indian Walk
- Miramar Plan at Indian Walk
- The Hoover Plan at Indian Walk
- 8705 Quietwood Ln
- 3696 Chestnut Park
- 3696 Chestnut Park Unit 6
- 3694 Chestnut Park
- 3694 Chestnut Park Unit 3
- 3692 Chestnut Park Unit 2
- 3702 Chestnut Park
- 3696 Chestnut Park Ln
- 3706 Chestnut Park Ln
- 3704 Chestnut Park Ln
- 3702 Chestnut Park
- 3696 Chestnut Park Unit 6
- 3702 Chestnut Park Unit 7
- 3692 Chestnut Park Unit LANE
- 3692 Chestnut Park Unit 2
- 3696 Chestnut Park
- 3702 Chestnut Park Unit 3
- 3690 Chestnut Park Ln Unit 4
- 3694 Chestnut Park
- 3694 Chestnut Park
- 3692 Chestnut Park