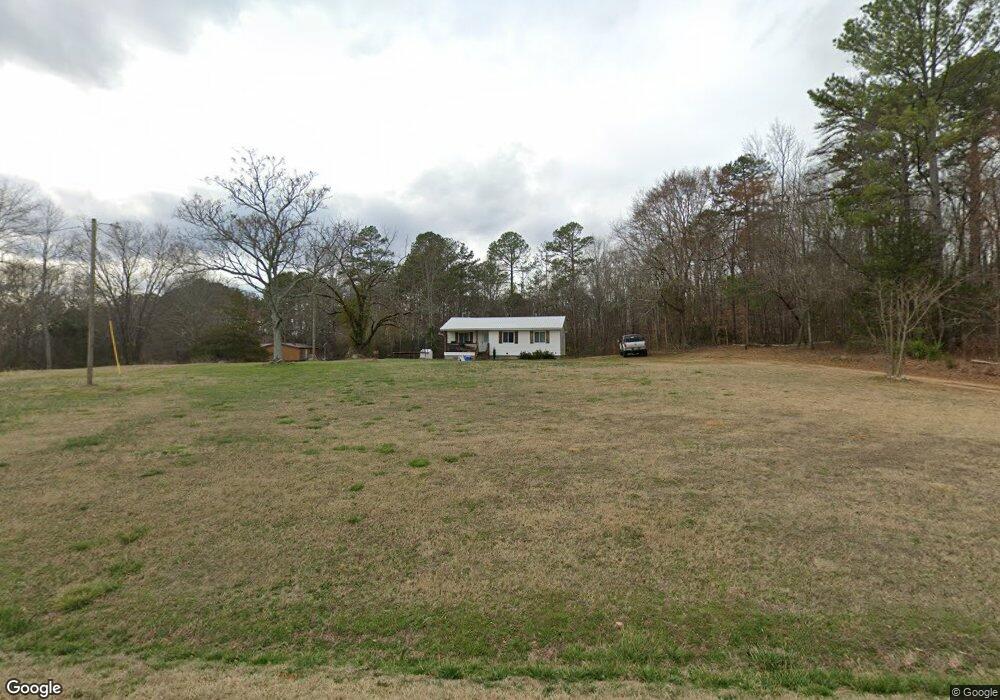
3696 Crabapple Hollow Rd Nicholson, GA 30565
Estimated Value: $227,000 - $328,000
3
Beds
1
Bath
1,136
Sq Ft
$226/Sq Ft
Est. Value
About This Home
This home is located at 3696 Crabapple Hollow Rd, Nicholson, GA 30565 and is currently estimated at $257,216, approximately $226 per square foot. 3696 Crabapple Hollow Rd is a home located in Madison County with nearby schools including Madison County High School.
Ownership History
Date
Name
Owned For
Owner Type
Purchase Details
Closed on
Nov 12, 2020
Sold by
Arnold Adam
Bought by
Arnold Adam and Arnold Katie
Current Estimated Value
Home Financials for this Owner
Home Financials are based on the most recent Mortgage that was taken out on this home.
Original Mortgage
$150,505
Outstanding Balance
$133,082
Interest Rate
2.8%
Mortgage Type
New Conventional
Estimated Equity
$124,134
Purchase Details
Closed on
Jul 16, 2020
Sold by
Sewell Dannie Lamar
Bought by
Jones Creek Properties Llc and Humphries Land & Cattle Co
Purchase Details
Closed on
May 13, 2004
Sold by
Sewell Zenaida D
Bought by
Sewell Dannie Lamar
Purchase Details
Closed on
Jan 1, 1997
Sold by
Sewell Mary
Bought by
Sewell Dannie Lamar
Purchase Details
Closed on
Jan 1, 1990
Sold by
Sewell Mary E
Bought by
Sewell Dannie Lamar
Purchase Details
Closed on
Jan 1, 1978
Sold by
Patterson Berta
Bought by
Sewell Mary E
Create a Home Valuation Report for This Property
The Home Valuation Report is an in-depth analysis detailing your home's value as well as a comparison with similar homes in the area
Home Values in the Area
Average Home Value in this Area
Purchase History
| Date | Buyer | Sale Price | Title Company |
|---|---|---|---|
| Arnold Adam | -- | -- | |
| Arnold Adam | $149,000 | -- | |
| Jones Creek Properties Llc | $42,000 | -- | |
| Sewell Dannie Lamar | -- | -- | |
| Sewell Dannie Lamar | -- | -- | |
| Sewell Dannie Lamar | -- | -- | |
| Sewell Dannie Lamar | -- | -- | |
| Sewell Mary E | -- | -- |
Source: Public Records
Mortgage History
| Date | Status | Borrower | Loan Amount |
|---|---|---|---|
| Open | Arnold Adam | $150,505 | |
| Closed | Arnold Adam | $150,505 |
Source: Public Records
Tax History Compared to Growth
Tax History
| Year | Tax Paid | Tax Assessment Tax Assessment Total Assessment is a certain percentage of the fair market value that is determined by local assessors to be the total taxable value of land and additions on the property. | Land | Improvement |
|---|---|---|---|---|
| 2024 | $1,422 | $54,618 | $9,446 | $45,172 |
| 2023 | $1,042 | $34,134 | $7,872 | $26,262 |
| 2022 | $785 | $28,472 | $5,411 | $23,061 |
| 2021 | $701 | $22,974 | $5,410 | $17,564 |
| 2020 | $682 | $22,187 | $4,624 | $17,563 |
| 2019 | $678 | $21,791 | $4,624 | $17,167 |
| 2018 | $652 | $20,911 | $4,230 | $16,681 |
| 2017 | $594 | $20,646 | $3,936 | $16,710 |
| 2016 | $502 | $17,479 | $3,577 | $13,902 |
| 2015 | $502 | $17,479 | $3,577 | $13,902 |
| 2014 | $505 | $17,476 | $3,433 | $14,043 |
| 2013 | -- | $17,476 | $3,433 | $14,043 |
Source: Public Records
Map
Nearby Homes
- 0 Nowhere Ln Unit 10544151
- 310 Sawdust Rd
- 1718 Ed Bennett Rd
- 130 Levi Trail
- 140 Levi Trail
- 1771 Leon Ellis Rd
- 425 Bob Holman Rd
- 2345 Seagraves Mill Rd
- 97 Abby Ln
- 10 Red Rose Rd
- 322 Cedar Tree Ln
- 170 Rocky Dr
- 2850 Commerce Rd
- 0 US Hwy 441 S Unit 20890220
- 424 Belhaven Ln
- 7 Red Rose Rd
- 9 Red Rose Rd
- 260 Oak Cir
- 166 Oak Cir
- 3638 Crabapple Hollow Rd
- 3804 Crabapple Hollow Rd
- 3801 Crabapple Hollow Rd
- 3870 Crabapple Hollow Rd
- 3805 Crabapple Hollow Rd
- 3415 Crabapple Hollow Rd
- 3960 Crabapple Hollow Rd
- 948 Pleasant Acres Farm Rd
- 736 Pleasant Acres Farm Rd
- 964 Pittman Matthews Rd
- 964 Pittman Matthews Rd
- 0 Pittman Matthews Rd
- 0 Pittman Matthews Rd Unit 7218250
- 0 Pittman Matthews Rd Unit 8655762
- 3277 Crabapple Hollow Rd
- 4055 Crabapple Hollow Rd
- 3253 Crabapple Hollow Rd
- 806 Pleasant Acres Farm Rd
- 465 Rocky Branch Hollow Rd