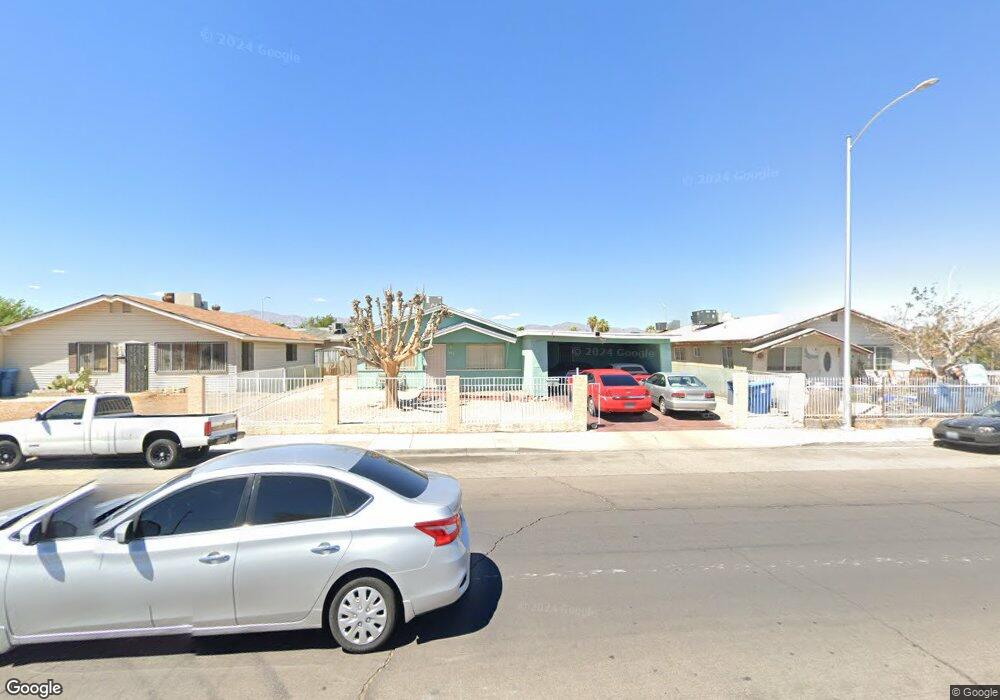
3696 E Gowan Rd Las Vegas, NV 89115
Estimated Value: $310,000 - $328,000
3
Beds
2
Baths
1,040
Sq Ft
$310/Sq Ft
Est. Value
About This Home
This home is located at 3696 E Gowan Rd, Las Vegas, NV 89115 and is currently estimated at $322,268, approximately $309 per square foot. 3696 E Gowan Rd is a home located in Clark County with nearby schools including Clyde C. Cox Elementary School, Gwendolyn Woolley Elementary School, and Marvin M Sedway Middle School.
Ownership History
Date
Name
Owned For
Owner Type
Purchase Details
Closed on
Dec 27, 2018
Sold by
Gutierrez Luis C and Gutierrez Leticia
Bought by
Sallis Kelvin D
Current Estimated Value
Home Financials for this Owner
Home Financials are based on the most recent Mortgage that was taken out on this home.
Original Mortgage
$171,830
Outstanding Balance
$153,000
Interest Rate
5.25%
Mortgage Type
FHA
Estimated Equity
$169,268
Purchase Details
Closed on
Jan 18, 2012
Sold by
Hsbc Bank Usa N A
Bought by
Gutierrez Luis C and Gutierrez Leticia
Purchase Details
Closed on
Oct 17, 2011
Sold by
Hernandez Rosario
Bought by
Hsbc Bank Usa N A
Purchase Details
Closed on
Dec 3, 1993
Sold by
Smith Christopher Eric and Smith Barbara L
Bought by
Hernandez Rosario
Home Financials for this Owner
Home Financials are based on the most recent Mortgage that was taken out on this home.
Original Mortgage
$65,033
Interest Rate
7.09%
Mortgage Type
FHA
Create a Home Valuation Report for This Property
The Home Valuation Report is an in-depth analysis detailing your home's value as well as a comparison with similar homes in the area
Home Values in the Area
Average Home Value in this Area
Purchase History
| Date | Buyer | Sale Price | Title Company |
|---|---|---|---|
| Sallis Kelvin D | $175,000 | Chicago Title Corporate C | |
| Gutierrez Luis C | $40,000 | Fidelity Rainbow | |
| Hsbc Bank Usa N A | $37,800 | Accommodation | |
| Hernandez Rosario | $65,000 | Old Republic Title Company |
Source: Public Records
Mortgage History
| Date | Status | Borrower | Loan Amount |
|---|---|---|---|
| Open | Sallis Kelvin D | $171,830 | |
| Previous Owner | Hernandez Rosario | $65,033 |
Source: Public Records
Tax History Compared to Growth
Tax History
| Year | Tax Paid | Tax Assessment Tax Assessment Total Assessment is a certain percentage of the fair market value that is determined by local assessors to be the total taxable value of land and additions on the property. | Land | Improvement |
|---|---|---|---|---|
| 2025 | $507 | $42,277 | $26,600 | $15,677 |
| 2024 | $493 | $42,277 | $26,600 | $15,677 |
| 2023 | $493 | $40,762 | $26,600 | $14,162 |
| 2022 | $562 | $35,064 | $22,400 | $12,664 |
| 2021 | $465 | $32,799 | $21,000 | $11,799 |
| 2020 | $448 | $30,361 | $18,900 | $11,461 |
| 2019 | $443 | $25,716 | $14,000 | $11,716 |
| 2018 | $422 | $23,885 | $12,250 | $11,635 |
| 2017 | $664 | $22,652 | $10,500 | $12,152 |
| 2016 | $397 | $21,347 | $8,400 | $12,947 |
| 2015 | $395 | $14,666 | $5,600 | $9,066 |
| 2014 | $382 | $14,817 | $3,850 | $10,967 |
Source: Public Records
Map
Nearby Homes
- 3630 Three Bars Ct
- 3540 Purdue
- 3501 Orvis St
- 3327 Rio Grande St
- 3508 Rio Robles Dr Unit D
- 3508 Rio Robles Dr Unit C
- 3508 Rio Robles Dr Unit A
- 3915 Eblick Wash Dr
- 3401 N Walnut Rd Unit 330
- 3401 N Walnut Rd Unit 121
- 3401 N Walnut Rd Unit 113
- 3401 N Walnut Rd Unit 109
- 3401 N Walnut Rd Unit 388
- 3401 N Walnut Rd Unit 235
- 3401 N Walnut Rd Unit 15
- 3401 N Walnut Rd Unit 236
- 3401 N Walnut Rd Unit 74
- 3401 N Walnut Rd Unit 13
- 3401 N Walnut Rd Unit 6
- 3401 N Walnut Rd Unit 402
- 3682 E Gowan Rd
- 3706 E Gowan Rd
- 3695 Blue Lake Ave
- 3683 Blue Lake Ave
- 3707 Blue Lake Ave
- 3718 E Gowan Rd
- 3670 E Gowan Rd
- 3671 Blue Lake Ave
- 3719 Blue Lake Ave
- 3596 Covey Ln
- 3730 E Gowan Rd
- 3658 E Gowan Rd
- 3659 Blue Lake Ave
- 3731 Blue Lake Ave
- 3648 Whispring Native Ct
- 3586 Covey Ln
- 3595 Sandy Ln
- 3628 Round Lake Dr
- 3642 Whispring Native Ct
- 3646 E Gowan Rd