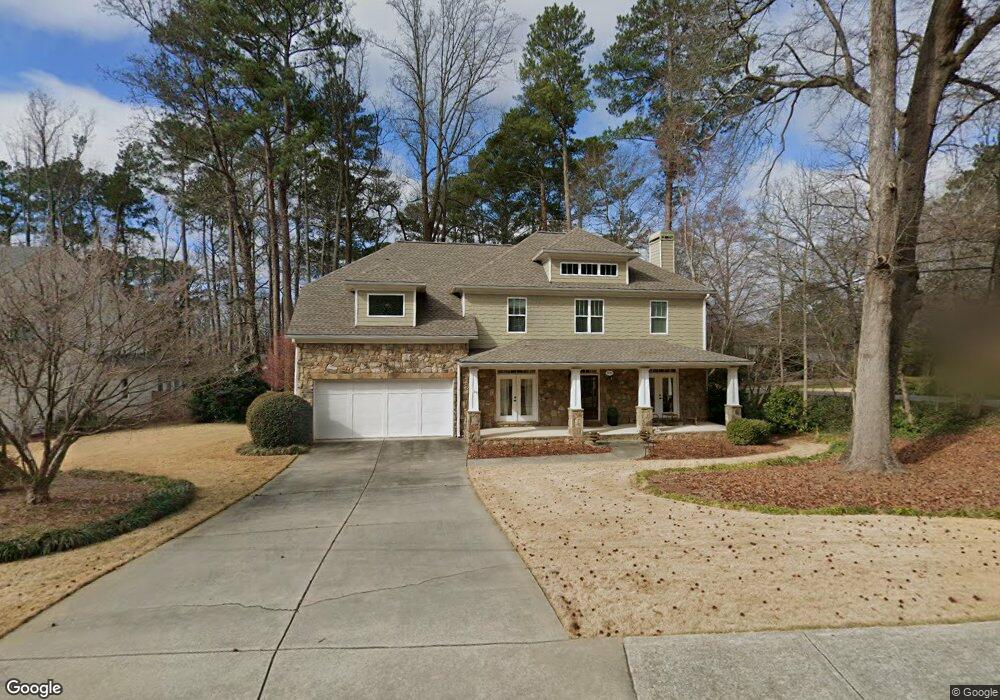
3696 Teal Rd Unit 3 Atlanta, GA 30341
Sexton Woods NeighborhoodEstimated Value: $958,662 - $1,154,000
4
Beds
4
Baths
3,057
Sq Ft
$349/Sq Ft
Est. Value
About This Home
This home is located at 3696 Teal Rd Unit 3, Atlanta, GA 30341 and is currently estimated at $1,068,166, approximately $349 per square foot. 3696 Teal Rd Unit 3 is a home located in DeKalb County with nearby schools including Montgomery Elementary School, Chamblee Middle School, and Chamblee Charter High School.
Ownership History
Date
Name
Owned For
Owner Type
Purchase Details
Closed on
Jun 4, 2007
Sold by
Murphy Robin B
Bought by
Murphy Frederick A and Murphy Robin B
Current Estimated Value
Home Financials for this Owner
Home Financials are based on the most recent Mortgage that was taken out on this home.
Original Mortgage
$545,300
Outstanding Balance
$337,621
Interest Rate
6.5%
Mortgage Type
New Conventional
Estimated Equity
$730,545
Purchase Details
Closed on
Sep 18, 2003
Sold by
Mckenzie Robin M
Bought by
Murphy Robin B
Home Financials for this Owner
Home Financials are based on the most recent Mortgage that was taken out on this home.
Original Mortgage
$37,800
Interest Rate
6.16%
Mortgage Type
New Conventional
Purchase Details
Closed on
May 3, 2001
Sold by
Tierney John B
Bought by
Murphy Frederick A
Home Financials for this Owner
Home Financials are based on the most recent Mortgage that was taken out on this home.
Original Mortgage
$157,500
Interest Rate
6.9%
Mortgage Type
New Conventional
Create a Home Valuation Report for This Property
The Home Valuation Report is an in-depth analysis detailing your home's value as well as a comparison with similar homes in the area
Home Values in the Area
Average Home Value in this Area
Purchase History
| Date | Buyer | Sale Price | Title Company |
|---|---|---|---|
| Murphy Frederick A | -- | -- | |
| Murphy Robin B | -- | -- | |
| Murphy Frederick A | $175,000 | -- |
Source: Public Records
Mortgage History
| Date | Status | Borrower | Loan Amount |
|---|---|---|---|
| Open | Murphy Frederick A | $545,300 | |
| Previous Owner | Murphy Robin B | $37,800 | |
| Previous Owner | Murphy Frederick A | $157,500 |
Source: Public Records
Tax History
| Year | Tax Paid | Tax Assessment Tax Assessment Total Assessment is a certain percentage of the fair market value that is determined by local assessors to be the total taxable value of land and additions on the property. | Land | Improvement |
|---|---|---|---|---|
| 2025 | $11,447 | $370,320 | $118,502 | $251,818 |
| 2024 | $11,515 | $378,360 | $121,760 | $256,600 |
| 2023 | $11,515 | $335,160 | $121,760 | $213,400 |
Source: Public Records
Map
Nearby Homes
- 3875 Donaldson Dr
- 1891 Harts Mill Rd NE
- 3677 School St
- 3509 Cold Spring Ln
- 1980 Raven Way
- 3736 Briar Ln
- 2002 Raven Way
- 2006 Raven Way
- 3715 Benton Ln
- 3553 Vanet Rd
- 1696 Harts Run
- 3788 Montford Dr
- 3866 Sidestreet
- 2044 Gramercy Cir
- 3635 Admiral Dr
- 3914 Granger Dr Unit 2
- 1694 Harts Mill Rd NE
- 3519 Brookleigh Ln NE
- 2045 Atz Cove
- 1997 Catnap Ct
- 3688 Teal Rd
- 3909 Donaldson Dr
- 3910 Donaldson Dr
- 3912 Donaldson Dr
- 3699 Teal Rd
- 3682 Teal Rd
- 3695 Teal Rd
- 1955 Harts Mill Rd NE Unit 4
- 3901 Donaldson Dr
- 3689 Teal Rd
- 3908 Donaldson Dr
- 3679 Keswick Dr
- 3683 Teal Rd
- 3676 Teal Rd Unit 3
- 1945 Harts Mill Rd NE
- 3902 Donaldson Dr
- 1961 Harts Mill Rd NE
- 3671 Keswick Dr
- 3679 Teal Rd
- 3670 Teal Rd
Your Personal Tour Guide
Ask me questions while you tour the home.