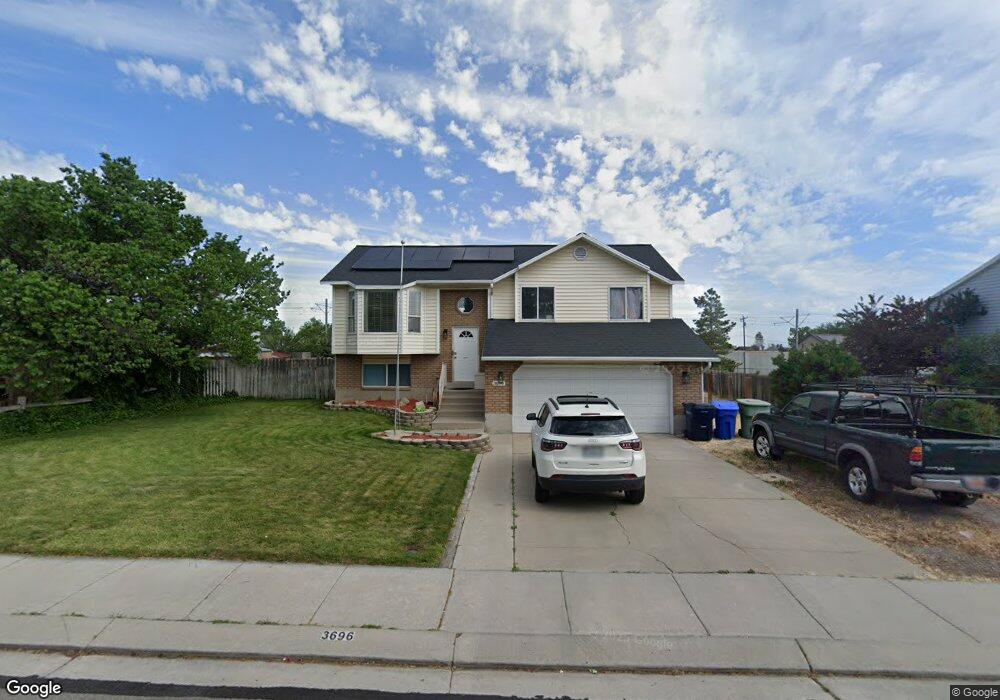
3696 Valley West Dr West Jordan, UT 84088
Jordan Oaks NeighborhoodEstimated Value: $485,000 - $638,000
6
Beds
2
Baths
1,042
Sq Ft
$509/Sq Ft
Est. Value
About This Home
This home is located at 3696 Valley West Dr, West Jordan, UT 84088 and is currently estimated at $530,613, approximately $509 per square foot. 3696 Valley West Dr is a home located in Salt Lake County with nearby schools including Terra Linda Elementary School, Joel P. Jensen Middle School, and West Jordan High School.
Ownership History
Date
Name
Owned For
Owner Type
Purchase Details
Closed on
Oct 24, 2023
Sold by
Babb Leslie
Bought by
Leslie Folkersen Living Trust and Folkersen
Current Estimated Value
Purchase Details
Closed on
Apr 8, 2019
Sold by
Moffett Leslie F and Babb Leslie
Bought by
Babb Leslie
Home Financials for this Owner
Home Financials are based on the most recent Mortgage that was taken out on this home.
Original Mortgage
$145,000
Interest Rate
4.3%
Mortgage Type
New Conventional
Purchase Details
Closed on
Jun 14, 2014
Sold by
Babb Jon
Bought by
Babb Leslie
Purchase Details
Closed on
Apr 13, 2005
Sold by
Moffett Leslie F
Bought by
Moffett Leslie F and Babb Jonathan Allyn
Purchase Details
Closed on
Nov 3, 2000
Sold by
Moffett Cory S
Bought by
Moffett Leslie F
Create a Home Valuation Report for This Property
The Home Valuation Report is an in-depth analysis detailing your home's value as well as a comparison with similar homes in the area
Home Values in the Area
Average Home Value in this Area
Purchase History
| Date | Buyer | Sale Price | Title Company |
|---|---|---|---|
| Leslie Folkersen Living Trust | -- | None Listed On Document | |
| Babb Leslie | -- | Frontier Title Ins Agcy Inc | |
| Babb Leslie | -- | None Available | |
| Moffett Leslie F | -- | Inwest Title Services | |
| Moffett Leslie F | -- | -- |
Source: Public Records
Mortgage History
| Date | Status | Borrower | Loan Amount |
|---|---|---|---|
| Previous Owner | Babb Leslie | $145,000 |
Source: Public Records
Tax History Compared to Growth
Tax History
| Year | Tax Paid | Tax Assessment Tax Assessment Total Assessment is a certain percentage of the fair market value that is determined by local assessors to be the total taxable value of land and additions on the property. | Land | Improvement |
|---|---|---|---|---|
| 2025 | $2,332 | $449,600 | $146,200 | $303,400 |
| 2024 | $2,332 | $448,700 | $144,700 | $304,000 |
| 2023 | $2,295 | $416,100 | $141,800 | $274,300 |
| 2022 | $2,394 | $427,100 | $139,100 | $288,000 |
| 2021 | $2,019 | $327,900 | $95,900 | $232,000 |
| 2020 | $1,663 | $253,400 | $78,600 | $174,800 |
| 2019 | $1,699 | $253,900 | $78,600 | $175,300 |
| 2018 | $1,571 | $232,900 | $76,500 | $156,400 |
| 2017 | $1,474 | $217,600 | $76,500 | $141,100 |
| 2016 | $1,406 | $195,000 | $76,500 | $118,500 |
| 2015 | $1,454 | $196,500 | $78,000 | $118,500 |
| 2014 | $1,393 | $185,400 | $74,300 | $111,100 |
Source: Public Records
Map
Nearby Homes
- 3888 W 8700 S
- 3931 W Dansere Cir
- 8983 S 3860 W
- 8461 S Meadowlark Ln
- 8400 S 4000 W Unit 134
- 3750 W Bingham Creek Dr
- 3214 W Monterey Pine Ln
- 8493 S 3200 W
- 3702 W Angus Dr
- 8941 S Sun Leaf Dr
- 3977 W Elwood Way
- 2990 W 8870 S
- 9441 S Newkirk St
- 8180 S Old Bingham Hwy
- 9375 S Laurel Ridge Cir
- 2970 W 8870 S
- 3112 Green Acre Dr
- 9526 Ember Glow Ct Unit C
- 7991 S 3725 W
- 8407 Meadow Green Way
- 3684 Valley West Dr
- 3708 Valley West Dr
- 8780 S 3680 W
- 3672 Valley West Dr
- 3720 Valley West Dr
- 8785 S 3715 W
- 3667 Valley West Dr
- 3667 W Valleywest Dr
- 3667 W Valleywest Dr
- 3732 W Valleywest Dr
- 3660 W Valleywest Dr
- 3732 Valley West Dr
- 3660 Valley West Dr
- 8794 S 3680 W
- 8797 S 3715 W
- 8781 S 3680 W
- 3727 W Valleywest Dr
- 3727 W Valleywest Dr
- 3727 Valley West Dr
- 8730 Newell Dr