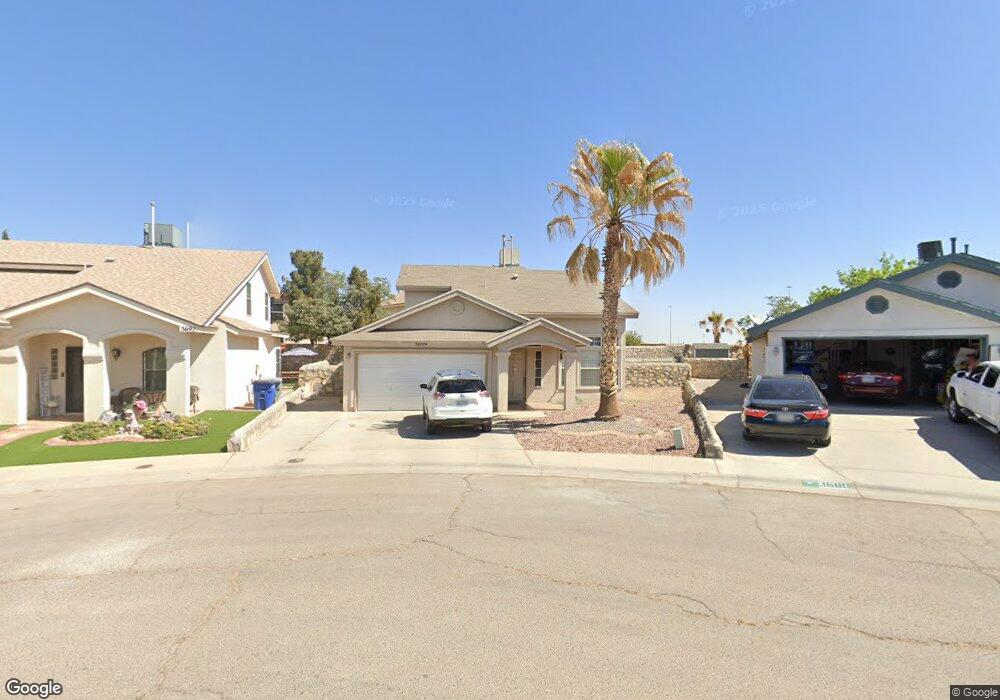
3699 Healy Dr Unit 1 El Paso, TX 79936
Montana East NeighborhoodEstimated Value: $218,969 - $230,000
3
Beds
2
Baths
1,652
Sq Ft
$135/Sq Ft
Est. Value
About This Home
This home is located at 3699 Healy Dr Unit 1, El Paso, TX 79936 and is currently estimated at $223,742, approximately $135 per square foot. 3699 Healy Dr Unit 1 is a home located in El Paso County with nearby schools including Jane A Hambric School and El Dorado High School.
Ownership History
Date
Name
Owned For
Owner Type
Purchase Details
Closed on
Oct 5, 2023
Sold by
Dejesus Raul and De Jesus Cristi
Bought by
Carrillo Vanessa Marie
Current Estimated Value
Home Financials for this Owner
Home Financials are based on the most recent Mortgage that was taken out on this home.
Original Mortgage
$201,286
Outstanding Balance
$197,409
Interest Rate
7.23%
Mortgage Type
FHA
Estimated Equity
$26,333
Purchase Details
Closed on
May 25, 2007
Sold by
Marquez Eugenia and Velarde Fernando
Bought by
Dejesus Raul and Dejesus Cristi
Home Financials for this Owner
Home Financials are based on the most recent Mortgage that was taken out on this home.
Original Mortgage
$135,000
Interest Rate
6.17%
Mortgage Type
Purchase Money Mortgage
Purchase Details
Closed on
May 9, 2002
Sold by
Carefree Homes I Lp
Bought by
Marquez Eugenia
Home Financials for this Owner
Home Financials are based on the most recent Mortgage that was taken out on this home.
Original Mortgage
$81,450
Interest Rate
7.1%
Create a Home Valuation Report for This Property
The Home Valuation Report is an in-depth analysis detailing your home's value as well as a comparison with similar homes in the area
Home Values in the Area
Average Home Value in this Area
Purchase History
| Date | Buyer | Sale Price | Title Company |
|---|---|---|---|
| Carrillo Vanessa Marie | -- | None Listed On Document | |
| Dejesus Raul | -- | None Available | |
| Marquez Eugenia | -- | -- |
Source: Public Records
Mortgage History
| Date | Status | Borrower | Loan Amount |
|---|---|---|---|
| Open | Carrillo Vanessa Marie | $201,286 | |
| Previous Owner | Dejesus Raul | $135,000 | |
| Previous Owner | Marquez Eugenia | $81,450 |
Source: Public Records
Tax History Compared to Growth
Tax History
| Year | Tax Paid | Tax Assessment Tax Assessment Total Assessment is a certain percentage of the fair market value that is determined by local assessors to be the total taxable value of land and additions on the property. | Land | Improvement |
|---|---|---|---|---|
| 2025 | $4,491 | $233,807 | $19,378 | $214,429 |
| 2024 | $4,491 | $217,923 | $19,378 | $198,545 |
| 2023 | $6,147 | $213,511 | $19,378 | $194,133 |
| 2022 | $5,778 | $199,490 | $19,378 | $180,112 |
| 2021 | $4,965 | $157,757 | $19,378 | $138,379 |
| 2020 | $3,934 | $123,940 | $19,378 | $104,562 |
| 2018 | $3,596 | $122,972 | $19,378 | $103,594 |
| 2017 | $3,466 | $121,324 | $19,378 | $101,946 |
| 2016 | $3,466 | $121,324 | $19,378 | $101,946 |
| 2015 | $3,364 | $121,324 | $19,378 | $101,946 |
| 2014 | $3,364 | $121,184 | $19,378 | $101,806 |
Source: Public Records
Map
Nearby Homes
- 36 Wells Park Lot 36
- 12050 Hosea St
- 3665 Healy Dr
- 3649 Joe Battle Blvd
- 3541 Al Roberts Dr
- 12261 Tierra Canada Dr
- 12232 Tierra Rosa Way
- 3628 W Vitex Cir
- 11856 Fiddlewood Cir
- 12237 Tierra Maya Dr
- 3485 Waterside Dr
- 12361 Tierra Laguna Dr
- 3650 Silver Palm Dr
- 12372 Tierra Apache Dr
- 11753 Bell Tower Dr
- 3257 Royal Jewel St
- 12301 Tierra Limpia Dr
- 3264 Mike Godwin Dr
- 11881 Snow Hawk Dr
- 3217 Manny Aguilera Dr
- 3699 Healy Dr
- 3699 Healy Dr
- 3697 Healy Dr
- 3660 Alline Place
- 12098 Hosea St
- 12094 Hosea St
- 3700 Exodus St
- 3695 Healy Dr
- 3656 Alline Place
- 12090 Hosea St
- 3693 Healy Dr
- 3654 Alline Place
- 12086 Hosea St
- 22174 Hosea St Unit 1
- 3704 Exodus St
- 3653 Alline Place
- 12082 Hosea St
- 3648 Alline Place
- 3691 Healy Dr
- 3708 Exodus St