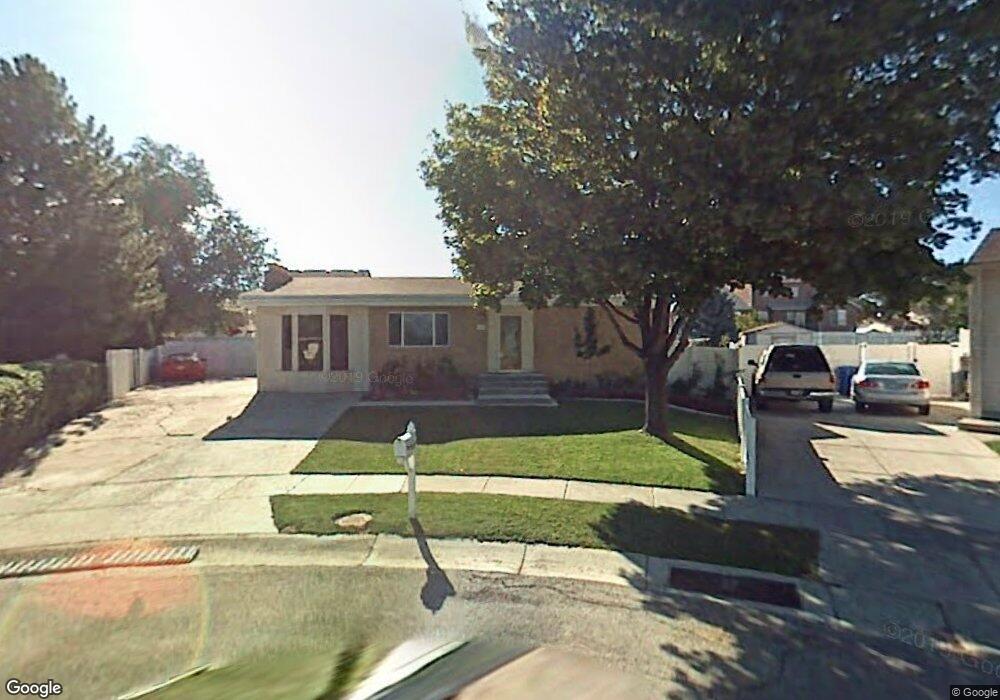
3699 W Savannah Cir West Jordan, UT 84084
Estimated Value: $497,500
4
Beds
2
Baths
2,100
Sq Ft
$237/Sq Ft
Est. Value
About This Home
This home is located at 3699 W Savannah Cir, West Jordan, UT 84084 and is currently priced at $497,500, approximately $236 per square foot. 3699 W Savannah Cir is a home located in Salt Lake County with nearby schools including Oquirrh Elementary School, Joel P. Jensen Middle School, and West Jordan High School.
Ownership History
Date
Name
Owned For
Owner Type
Purchase Details
Closed on
Apr 7, 2022
Sold by
Opendoor Property Trust
Bought by
Bautista Sofia and Solorio Isidoro
Current Estimated Value
Home Financials for this Owner
Home Financials are based on the most recent Mortgage that was taken out on this home.
Original Mortgage
$484,500
Outstanding Balance
$457,288
Interest Rate
4.72%
Mortgage Type
New Conventional
Purchase Details
Closed on
Aug 19, 2020
Sold by
Carlson Leon and Carlson Vicki
Bought by
Snyder Keira and Harris Nathan
Home Financials for this Owner
Home Financials are based on the most recent Mortgage that was taken out on this home.
Original Mortgage
$315,185
Interest Rate
3%
Mortgage Type
FHA
Purchase Details
Closed on
Oct 27, 2004
Sold by
Collins Shauna B
Bought by
Carlson Leon and Carlson Vicki
Purchase Details
Closed on
Jun 12, 1999
Sold by
Jordan Landing Llc
Bought by
Collins Shauna B
Purchase Details
Closed on
Sep 27, 1995
Sold by
Collins Shauna B
Bought by
Collins Shauna B
Create a Home Valuation Report for This Property
The Home Valuation Report is an in-depth analysis detailing your home's value as well as a comparison with similar homes in the area
Home Values in the Area
Average Home Value in this Area
Purchase History
| Date | Buyer | Sale Price | Title Company |
|---|---|---|---|
| Bautista Sofia | -- | Cottonwood Title | |
| Snyder Keira | -- | Title One | |
| Carlson Leon | -- | Title One | |
| Collins Shauna B | -- | Metro National Title | |
| Collins Shauna B | -- | -- |
Source: Public Records
Mortgage History
| Date | Status | Borrower | Loan Amount |
|---|---|---|---|
| Open | Bautista Sofia | $484,500 | |
| Previous Owner | Snyder Keira | $315,185 |
Source: Public Records
Tax History Compared to Growth
Tax History
| Year | Tax Paid | Tax Assessment Tax Assessment Total Assessment is a certain percentage of the fair market value that is determined by local assessors to be the total taxable value of land and additions on the property. | Land | Improvement |
|---|---|---|---|---|
| 2021 | $1,933 | $294,600 | $67,200 | $227,400 |
| 2020 | $1,933 | $294,600 | $67,200 | $227,400 |
| 2019 | $0 | $282,700 | $67,200 | $215,500 |
| 2018 | $0 | $229,200 | $63,400 | $165,800 |
| 2017 | $1,388 | $204,900 | $63,400 | $141,500 |
| 2016 | $1,263 | $175,100 | $63,400 | $111,700 |
| 2015 | -- | $170,400 | $62,800 | $107,600 |
| 2014 | $1,204 | $160,300 | $59,800 | $100,500 |
Source: Public Records
Map
Nearby Homes
- 6978 W Terraine Rd
- 6992 W Terraine Rd
- 6968 S 3535 W Unit 3
- 6980 S 3535 W Unit 2
- 3660 Ashland Cir
- 3695 Carolina Dr
- 3770 W Carolina Dr
- 3963 W Hollandia Ln
- 3383 W 6880 S
- 6672 S 3335 W
- 6482 S Gold Medal Dr
- 3538 W Biathlon Cir
- 3537 W Green Springs Ln
- 6893 S 3200 W
- 4164 W Millsden Ln
- 6280 Laura Jo Ln
- 3305 W Kingsbrook Ave
- 6377 Fairwind Dr
- 6330 S 4015 W
- 6222 S Westbrook Dr
- 3699 Savannah Cir
- 3739 New Village Rd
- 3695 W Savannah Cir
- 3696 Savannah Cir
- 3695 Savannah Cir
- 6817 S Jordan Village Rd
- 6817 Jordan Village Rd
- 6825 S Jordan Village Rd
- 6809 Jordan Village Rd
- 6825 Jordan Village Rd
- 3684 W Savannah Cir
- 3684 Savannah Cir
- 3683 Savannah Cir
- 6833 Jordan Village Rd
- 6801 Jordan Village Rd
- 3698 Decatur Cir
- 3707 Kentucky Dr
- 3707 W Kentucky Dr
- 6841 Jordan Village Rd
- 6808 Georgia Dr