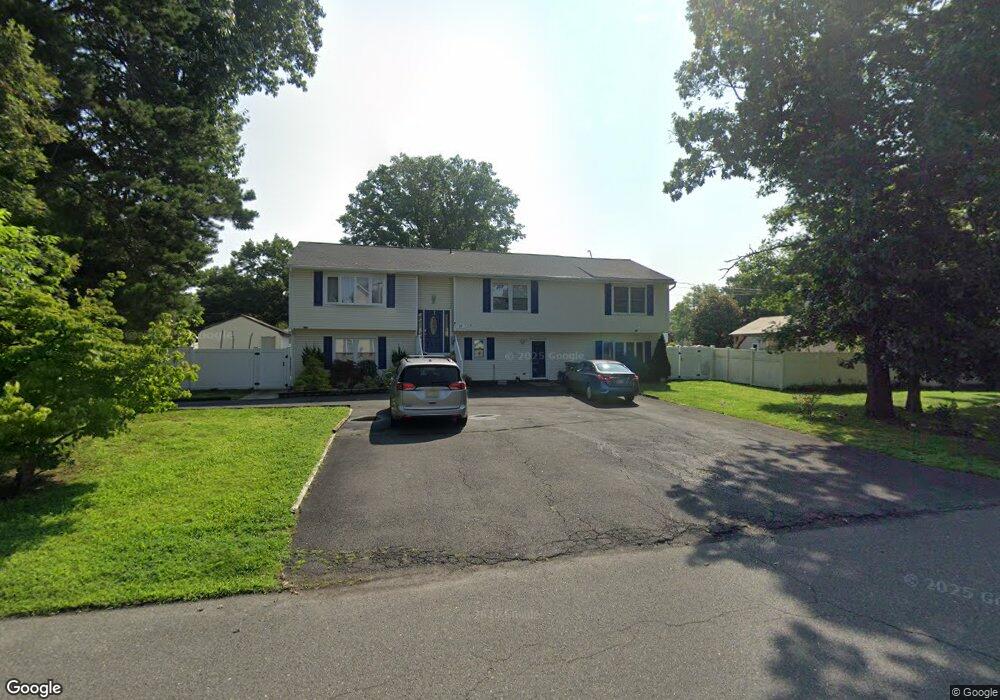
37 13th St Monroe Township, NJ 08831
Estimated Value: $839,214 - $950,000
4
Beds
3
Baths
3,068
Sq Ft
$297/Sq Ft
Est. Value
About This Home
This home is located at 37 13th St, Monroe Township, NJ 08831 and is currently estimated at $911,804, approximately $297 per square foot. 37 13th St is a home located in Middlesex County with nearby schools including Mill Lake Elementary School, Woodland Elementary School, and Monroe Township Middle School.
Ownership History
Date
Name
Owned For
Owner Type
Purchase Details
Closed on
Jul 16, 2019
Sold by
Candella Michael
Bought by
Avila Yancy and Acevedo Arlin
Current Estimated Value
Home Financials for this Owner
Home Financials are based on the most recent Mortgage that was taken out on this home.
Original Mortgage
$233,000
Outstanding Balance
$204,029
Interest Rate
3.9%
Mortgage Type
New Conventional
Estimated Equity
$707,775
Purchase Details
Closed on
May 16, 2017
Sold by
Wamu Mortgage Pass Throug H Certificat E and Wells Fargo Bank
Bought by
Candella Michael
Home Financials for this Owner
Home Financials are based on the most recent Mortgage that was taken out on this home.
Interest Rate
4.05%
Purchase Details
Closed on
Oct 21, 2015
Sold by
Martucci Ann C
Bought by
Wells Fargo Bank Na
Purchase Details
Closed on
Sep 4, 1985
Bought by
Martucci Joseph and Martucci Ann
Create a Home Valuation Report for This Property
The Home Valuation Report is an in-depth analysis detailing your home's value as well as a comparison with similar homes in the area
Home Values in the Area
Average Home Value in this Area
Purchase History
| Date | Buyer | Sale Price | Title Company |
|---|---|---|---|
| Avila Yancy | $485,000 | Watson Abstract Setmnt Svcs | |
| Candella Michael | $290,000 | -- | |
| Wells Fargo Bank Na | -- | None Available | |
| Martucci Joseph | $103,500 | -- |
Source: Public Records
Mortgage History
| Date | Status | Borrower | Loan Amount |
|---|---|---|---|
| Open | Avila Yancy | $233,000 | |
| Previous Owner | Candella Michael | -- |
Source: Public Records
Tax History Compared to Growth
Tax History
| Year | Tax Paid | Tax Assessment Tax Assessment Total Assessment is a certain percentage of the fair market value that is determined by local assessors to be the total taxable value of land and additions on the property. | Land | Improvement |
|---|---|---|---|---|
| 2025 | $11,474 | $411,100 | $173,000 | $238,100 |
| 2024 | $11,075 | $411,100 | $173,000 | $238,100 |
| 2023 | $11,075 | $411,100 | $173,000 | $238,100 |
| 2022 | $10,902 | $411,100 | $173,000 | $238,100 |
| 2021 | $8,001 | $404,700 | $173,000 | $231,700 |
| 2020 | $10,439 | $395,700 | $173,000 | $222,700 |
| 2019 | $9,862 | $382,100 | $173,000 | $209,100 |
| 2018 | $9,786 | $382,100 | $173,000 | $209,100 |
| 2017 | $9,595 | $382,100 | $173,000 | $209,100 |
| 2016 | $9,453 | $382,100 | $173,000 | $209,100 |
| 2015 | $9,186 | $382,100 | $173,000 | $209,100 |
| 2014 | $8,811 | $382,100 | $173,000 | $209,100 |
Source: Public Records
Map
Nearby Homes