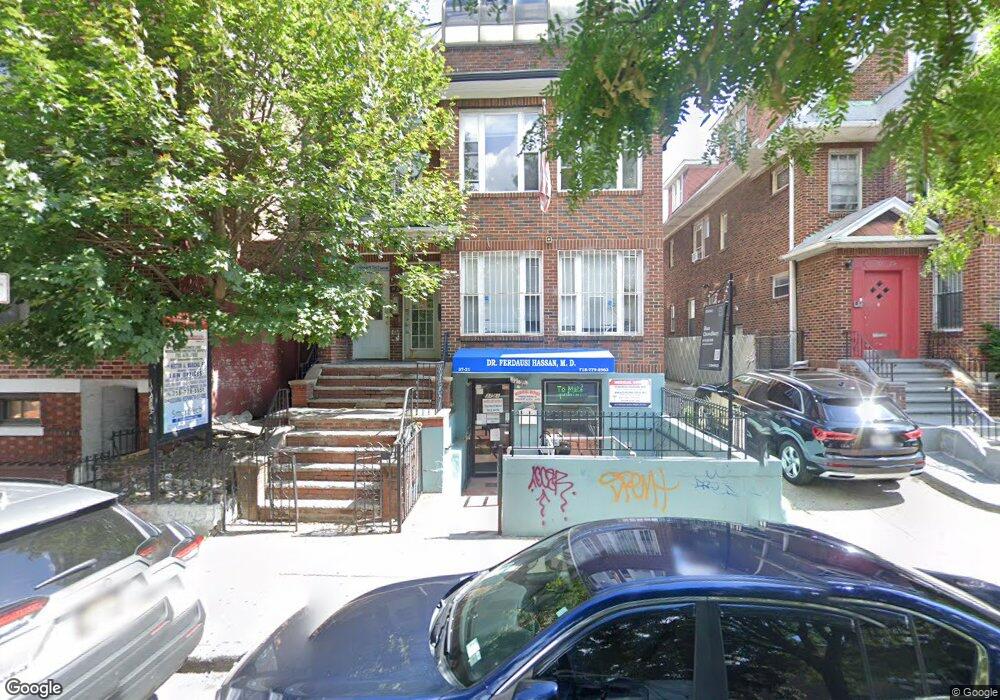
37-21 75th St Jackson Heights, NY 11372
Jackson Heights NeighborhoodEstimated Value: $3,169,855
--
Bed
--
Bath
5,534
Sq Ft
$573/Sq Ft
Est. Value
About This Home
This home is located at 37-21 75th St, Jackson Heights, NY 11372 and is currently estimated at $3,169,855, approximately $572 per square foot. 37-21 75th St is a home located in Queens County with nearby schools including P.S. 69 Jackson Heights, I.S. 230, and William Cullen Bryant High School.
Ownership History
Date
Name
Owned For
Owner Type
Purchase Details
Closed on
May 6, 2025
Sold by
Bali Associates Llc and Muskan Real Estate Inc
Bought by
Chhaya Community Development Corp
Current Estimated Value
Purchase Details
Closed on
Jun 4, 2013
Sold by
Muskan Real Estate Incorporated
Bought by
Bali Associates Llc and Muskan Real Estate Incorporated
Purchase Details
Closed on
Jul 6, 2005
Sold by
37-21 Realty Corp
Bought by
Muskan Real Estate Incorporated
Home Financials for this Owner
Home Financials are based on the most recent Mortgage that was taken out on this home.
Original Mortgage
$850,000
Interest Rate
5.59%
Mortgage Type
Commercial
Purchase Details
Closed on
Aug 18, 2003
Sold by
Guzman Marcos and Guzman Nilda
Bought by
Olivares Juan
Purchase Details
Closed on
Dec 8, 1993
Sold by
Rodriguez Rene
Bought by
37-21 Realty Corp
Create a Home Valuation Report for This Property
The Home Valuation Report is an in-depth analysis detailing your home's value as well as a comparison with similar homes in the area
Home Values in the Area
Average Home Value in this Area
Purchase History
| Date | Buyer | Sale Price | Title Company |
|---|---|---|---|
| Chhaya Community Development Corp | $3,200,000 | -- | |
| Bali Associates Llc | $1,100,000 | -- | |
| Bali Associates Llc | $1,100,000 | -- | |
| Muskan Real Estate Incorporated | $1,600,000 | -- | |
| Muskan Real Estate Incorporated | $1,600,000 | -- | |
| Olivares Juan | -- | -- | |
| Olivares Juan | -- | -- | |
| 37-21 Realty Corp | -- | Lawyers Title Insurance Corp | |
| 37-21 Realty Corp | -- | Lawyers Title Insurance Corp |
Source: Public Records
Mortgage History
| Date | Status | Borrower | Loan Amount |
|---|---|---|---|
| Previous Owner | Muskan Real Estate Incorporated | $850,000 |
Source: Public Records
Tax History Compared to Growth
Tax History
| Year | Tax Paid | Tax Assessment Tax Assessment Total Assessment is a certain percentage of the fair market value that is determined by local assessors to be the total taxable value of land and additions on the property. | Land | Improvement |
|---|---|---|---|---|
| 2025 | $33,698 | $336,510 | $144,000 | $192,510 |
| 2024 | $33,698 | $318,150 | $144,000 | $174,150 |
| 2023 | $37,883 | $357,660 | $144,000 | $213,660 |
| 2022 | $37,169 | $366,300 | $144,000 | $222,300 |
| 2021 | $30,318 | $283,500 | $144,000 | $139,500 |
| 2020 | $35,629 | $383,850 | $144,000 | $239,850 |
| 2019 | $31,569 | $380,250 | $144,000 | $236,250 |
| 2018 | $31,387 | $298,530 | $79,200 | $219,330 |
| 2017 | $30,233 | $287,551 | $79,200 | $208,351 |
| 2016 | $29,102 | $287,551 | $79,200 | $208,351 |
| 2015 | $16,878 | $259,291 | $79,200 | $180,091 |
| 2014 | $16,878 | $243,811 | $79,200 | $164,611 |
Source: Public Records
Map
Nearby Homes
- 3745 75th St
- 3747 76th St
- 4015 76th St
- 40-24 76th St Unit 3B
- 40-24 76th St Unit 4A
- 40-40 75th St Unit 7C
- 40-40 75th St Unit 3J
- 40-33 74th St
- 4040 75th St Unit 5D
- 40 E 73rd St
- 4037 77th St Unit 5
- 35-55 76th St Unit 52
- 37-37 78th St
- 40-43 73rd St
- 35-35 75th St Unit 522
- 35-35 75th St Unit 122
- 3535 75th St Unit 208
- 3535 75th St Unit 123
- 3540 75th St Unit 5B
- 35-38 75th St Unit 2F
- 37-21 75th St Unit 3Fl
- 37-21 75th St Unit 3F
- 3721 75th St
- 3721 75th St
- 37-25 75th St Unit 3rd Fl
- 3725 75th St Unit 3rd Fl
- 3717 75th St
- 3725 75th St
- 37-29 75th St Unit 2F
- 3729 75th St
- 3720 76th St
- 3724 76th St
- 3724 76th St Unit 2
- 3718 76th St
- 3716 76th St
- 37-33 75th St
- 37-33 75th St Unit 4
- 3733 75th St
- 3726 76th St
- 37-26 76th St Unit Office