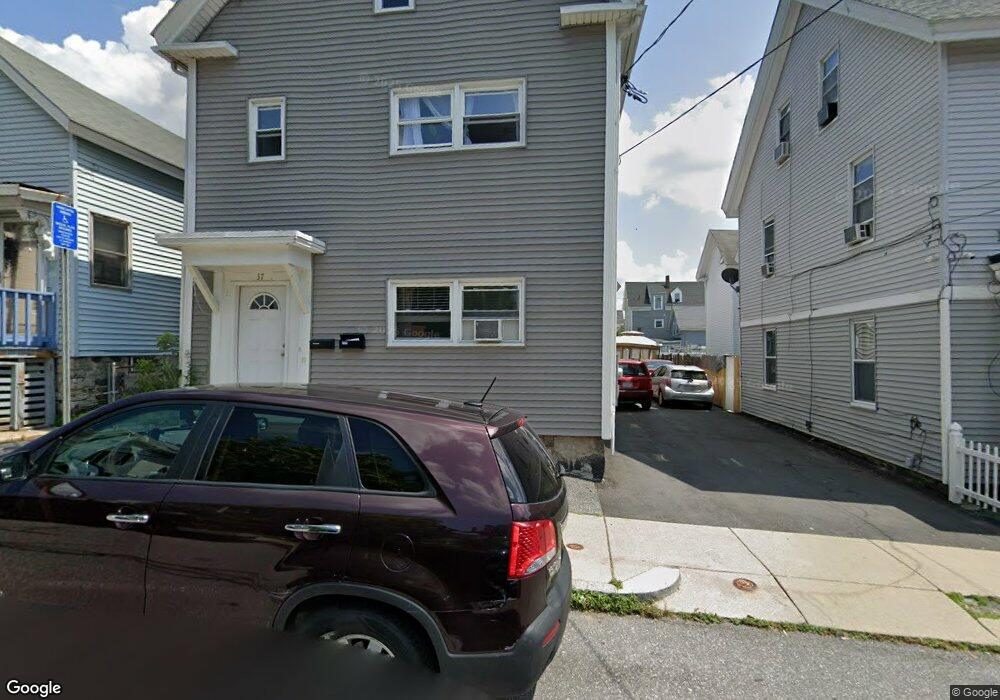
37 Albion St Unit 2 Lowell, MA 01850
Centralville NeighborhoodEstimated Value: $516,000 - $818,000
3
Beds
1
Bath
1,100
Sq Ft
$589/Sq Ft
Est. Value
About This Home
This home is located at 37 Albion St Unit 2, Lowell, MA 01850 and is currently estimated at $648,188, approximately $589 per square foot. 37 Albion St Unit 2 is a home located in Middlesex County with nearby schools including Greenhalge Elementary School, S. Christa McAuliffe Elementary School, and Moody Elementary School.
Ownership History
Date
Name
Owned For
Owner Type
Purchase Details
Closed on
Apr 3, 2024
Sold by
Conley Martin J and Conley Brendan
Bought by
Conley Ft and Conley
Current Estimated Value
Purchase Details
Closed on
Sep 4, 2007
Sold by
Wells Fargo Bk
Bought by
Hennessy Michael and Keenan Patrick
Purchase Details
Closed on
May 22, 2007
Sold by
Karani Lynette W and Wells Fargo Bk
Bought by
Wells Fargo Bk
Purchase Details
Closed on
Mar 31, 2004
Sold by
Waithaka Njoki
Bought by
Karani Lynette W and Karani Mary E
Purchase Details
Closed on
Nov 19, 2002
Sold by
Gichangah Augustine and Kimungu Kariuki P
Bought by
Waithaka Njoki
Purchase Details
Closed on
Jul 29, 1992
Sold by
Lifs Inc
Bought by
Kimungu Kariuki P and Gichangah Augustine
Create a Home Valuation Report for This Property
The Home Valuation Report is an in-depth analysis detailing your home's value as well as a comparison with similar homes in the area
Home Values in the Area
Average Home Value in this Area
Purchase History
| Date | Buyer | Sale Price | Title Company |
|---|---|---|---|
| Conley Ft | -- | None Available | |
| Conley Ft | -- | None Available | |
| Hennessy Michael | $146,000 | -- | |
| Hennessy Michael | $146,000 | -- | |
| Wells Fargo Bk | $240,947 | -- | |
| Wells Fargo Bk | $240,947 | -- | |
| Karani Lynette W | $250,000 | -- | |
| Karani Lynette W | $250,000 | -- | |
| Waithaka Njoki | $187,250 | -- | |
| Waithaka Njoki | $187,250 | -- | |
| Kimungu Kariuki P | $9,000 | -- | |
| Kimungu Kariuki P | $9,000 | -- |
Source: Public Records
Mortgage History
| Date | Status | Borrower | Loan Amount |
|---|---|---|---|
| Previous Owner | Kimungu Kariuki P | $240,000 | |
| Previous Owner | Kimungu Kariuki P | $172,000 |
Source: Public Records
Tax History Compared to Growth
Tax History
| Year | Tax Paid | Tax Assessment Tax Assessment Total Assessment is a certain percentage of the fair market value that is determined by local assessors to be the total taxable value of land and additions on the property. | Land | Improvement |
|---|---|---|---|---|
| 2025 | $7,216 | $628,600 | $95,600 | $533,000 |
| 2024 | $6,611 | $555,100 | $84,100 | $471,000 |
| 2023 | $6,167 | $496,500 | $73,100 | $423,400 |
| 2022 | $2,789 | $219,800 | $62,300 | $157,500 |
| 2021 | $2,584 | $192,000 | $54,100 | $137,900 |
| 2020 | $2,538 | $190,000 | $62,900 | $127,100 |
| 2019 | $3,485 | $248,200 | $55,500 | $192,700 |
| 2018 | $2,976 | $225,400 | $52,900 | $172,500 |
| 2017 | $3,065 | $205,400 | $48,100 | $157,300 |
| 2016 | $3,009 | $198,500 | $39,100 | $159,400 |
| 2015 | $2,731 | $176,400 | $37,400 | $139,000 |
| 2013 | $2,457 | $163,700 | $45,700 | $118,000 |
Source: Public Records
Map
Nearby Homes