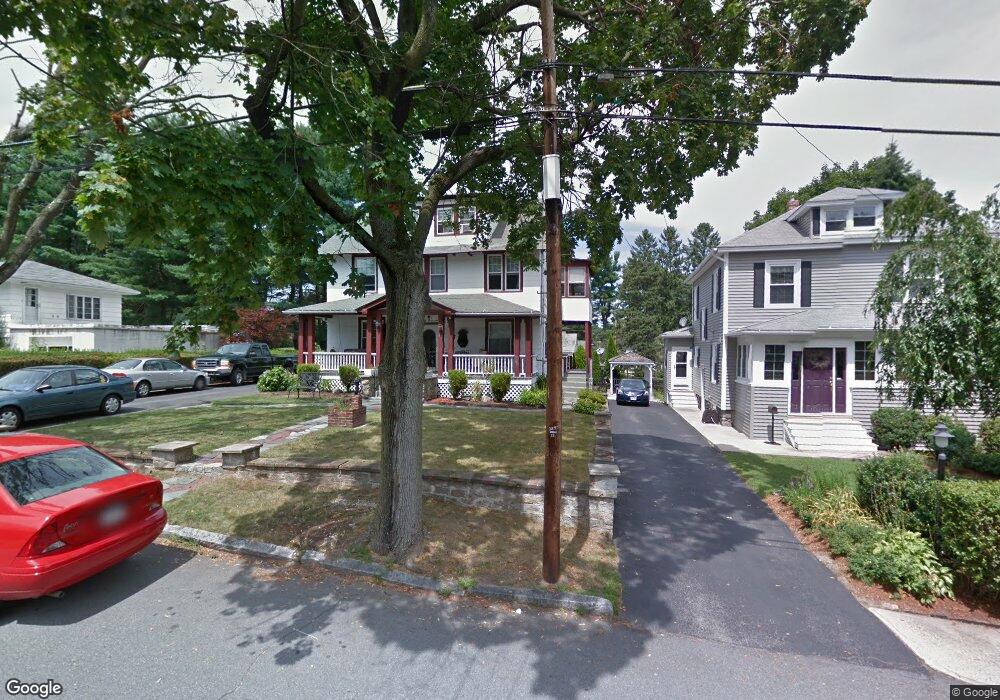
37 Albion St Unit 2 Methuen, MA 01844
The East End NeighborhoodEstimated Value: $717,809 - $745,000
3
Beds
1
Bath
2,578
Sq Ft
$284/Sq Ft
Est. Value
About This Home
This home is located at 37 Albion St Unit 2, Methuen, MA 01844 and is currently estimated at $732,952, approximately $284 per square foot. 37 Albion St Unit 2 is a home located in Essex County with nearby schools including Timony Grammar School, South Point Elementary School, and Methuen High School.
Ownership History
Date
Name
Owned For
Owner Type
Purchase Details
Closed on
Dec 17, 2010
Sold by
Preferred Constr Llc
Bought by
Cianciolo Joseph F
Current Estimated Value
Home Financials for this Owner
Home Financials are based on the most recent Mortgage that was taken out on this home.
Original Mortgage
$218,800
Outstanding Balance
$143,500
Interest Rate
4.23%
Mortgage Type
Purchase Money Mortgage
Estimated Equity
$589,452
Purchase Details
Closed on
Sep 8, 2008
Sold by
Michaud Lt and Michaud
Bought by
Preferred Constr Llc
Purchase Details
Closed on
Jun 9, 2004
Sold by
Michaud Joseph and Michaud Hermance
Bought by
Michaud Lt and Michaud
Create a Home Valuation Report for This Property
The Home Valuation Report is an in-depth analysis detailing your home's value as well as a comparison with similar homes in the area
Home Values in the Area
Average Home Value in this Area
Purchase History
| Date | Buyer | Sale Price | Title Company |
|---|---|---|---|
| Cianciolo Joseph F | $273,500 | -- | |
| Cianciolo Joseph F | $273,500 | -- | |
| Cianciolo Joseph F | $273,500 | -- | |
| Cianciolo Joseph F | $273,500 | -- | |
| Preferred Constr Llc | $286,500 | -- | |
| Preferred Constr Llc | $286,500 | -- | |
| Preferred Constr Llc | $286,500 | -- | |
| Preferred Constr Llc | $286,500 | -- | |
| Michaud Lt | -- | -- | |
| Michaud Lt | -- | -- | |
| Michaud Lt | -- | -- | |
| Michaud Lt | -- | -- |
Source: Public Records
Mortgage History
| Date | Status | Borrower | Loan Amount |
|---|---|---|---|
| Open | Cianciolo Joseph F | $218,800 | |
| Closed | Michaud Lt | $218,800 |
Source: Public Records
Tax History Compared to Growth
Tax History
| Year | Tax Paid | Tax Assessment Tax Assessment Total Assessment is a certain percentage of the fair market value that is determined by local assessors to be the total taxable value of land and additions on the property. | Land | Improvement |
|---|---|---|---|---|
| 2025 | $7,099 | $671,000 | $196,200 | $474,800 |
| 2024 | $6,490 | $597,600 | $179,000 | $418,600 |
| 2023 | $6,055 | $517,500 | $159,100 | $358,400 |
| 2022 | $5,568 | $426,700 | $132,600 | $294,100 |
| 2021 | $5,329 | $404,000 | $125,900 | $278,100 |
| 2020 | $4,997 | $371,800 | $125,900 | $245,900 |
| 2019 | $4,806 | $338,700 | $112,700 | $226,000 |
| 2018 | $4,476 | $313,700 | $112,700 | $201,000 |
| 2017 | $4,385 | $299,300 | $112,700 | $186,600 |
| 2016 | $4,142 | $279,700 | $106,000 | $173,700 |
| 2015 | $3,888 | $266,300 | $106,000 | $160,300 |
Source: Public Records
Map
Nearby Homes