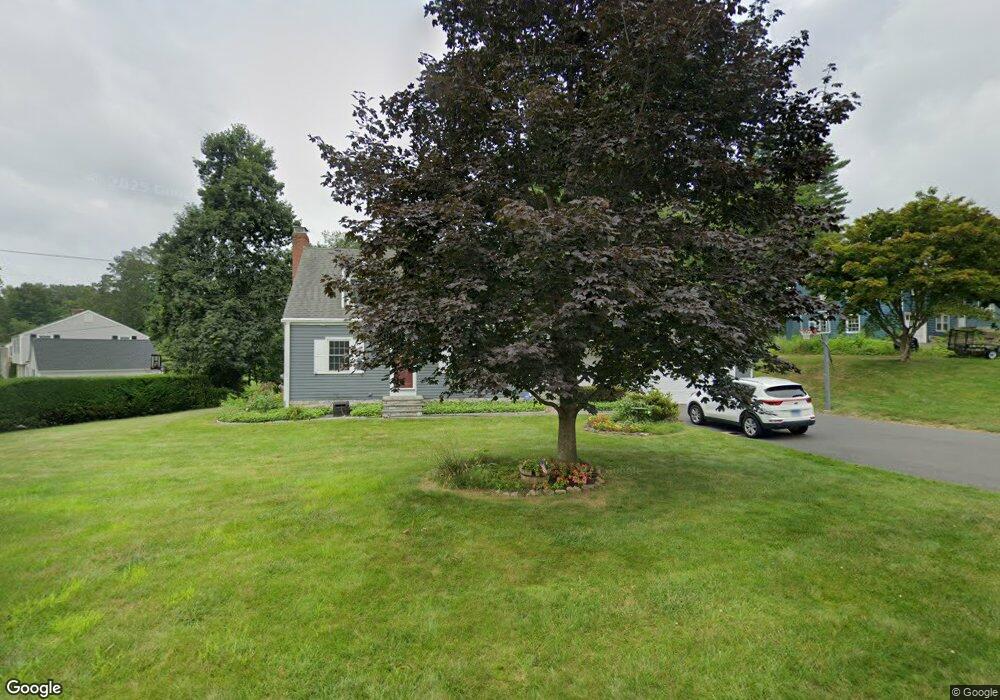
37 Alder Rd Simsbury, CT 06070
Estimated Value: $489,407 - $530,000
3
Beds
2
Baths
1,784
Sq Ft
$285/Sq Ft
Est. Value
About This Home
This home is located at 37 Alder Rd, Simsbury, CT 06070 and is currently estimated at $509,102, approximately $285 per square foot. 37 Alder Rd is a home located in Hartford County with nearby schools including Squadron Line School, Henry James Memorial School, and Simsbury High School.
Ownership History
Date
Name
Owned For
Owner Type
Purchase Details
Closed on
Jul 11, 2013
Sold by
Churilla Michael P and Churilla Juanita L
Bought by
Jennings David B and Jennings Laura M
Current Estimated Value
Home Financials for this Owner
Home Financials are based on the most recent Mortgage that was taken out on this home.
Original Mortgage
$232,000
Outstanding Balance
$168,054
Interest Rate
3.83%
Estimated Equity
$341,048
Create a Home Valuation Report for This Property
The Home Valuation Report is an in-depth analysis detailing your home's value as well as a comparison with similar homes in the area
Home Values in the Area
Average Home Value in this Area
Purchase History
| Date | Buyer | Sale Price | Title Company |
|---|---|---|---|
| Jennings David B | $290,000 | -- |
Source: Public Records
Mortgage History
| Date | Status | Borrower | Loan Amount |
|---|---|---|---|
| Open | Jennings David B | $232,000 | |
| Previous Owner | Jennings David B | $100,000 | |
| Previous Owner | Jennings David B | $116,000 |
Source: Public Records
Tax History
| Year | Tax Paid | Tax Assessment Tax Assessment Total Assessment is a certain percentage of the fair market value that is determined by local assessors to be the total taxable value of land and additions on the property. | Land | Improvement |
|---|---|---|---|---|
| 2025 | $8,312 | $243,320 | $75,880 | $167,440 |
| 2024 | $8,105 | $243,320 | $75,880 | $167,440 |
| 2023 | $7,742 | $243,320 | $75,880 | $167,440 |
| 2022 | $7,146 | $184,980 | $80,380 | $104,600 |
| 2021 | $7,146 | $184,980 | $80,380 | $104,600 |
| 2020 | $6,861 | $184,980 | $80,380 | $104,600 |
| 2019 | $6,903 | $184,980 | $80,380 | $104,600 |
| 2018 | $6,953 | $184,980 | $80,380 | $104,600 |
| 2017 | $6,524 | $168,330 | $80,380 | $87,950 |
| 2016 | $6,248 | $168,330 | $80,380 | $87,950 |
| 2015 | $6,248 | $168,330 | $80,380 | $87,950 |
| 2014 | $6,252 | $168,330 | $80,380 | $87,950 |
Source: Public Records
Map
Nearby Homes
- 92 Laurel Ln
- 7 Grimes Brook Place
- 36 Clifdon Dr
- 16 Richard Rd
- 14 Richard Rd
- 121 Hoskins Rd
- 7 School House Ln
- 14 North Dr
- 42 Holcomb St
- 28 Great Pond Rd
- 10 Litchfield Dr
- 5 Sanctuary Dr
- 31 Oxford Ct
- 89 Hop Brook Rd
- 79 Cambridge Ct
- 3 Lenora Dr
- 59 Cambridge Ct
- 100 Cambridge Ct
- 324 Old Farms Rd
- 6 Heritage Ln
Your Personal Tour Guide
Ask me questions while you tour the home.