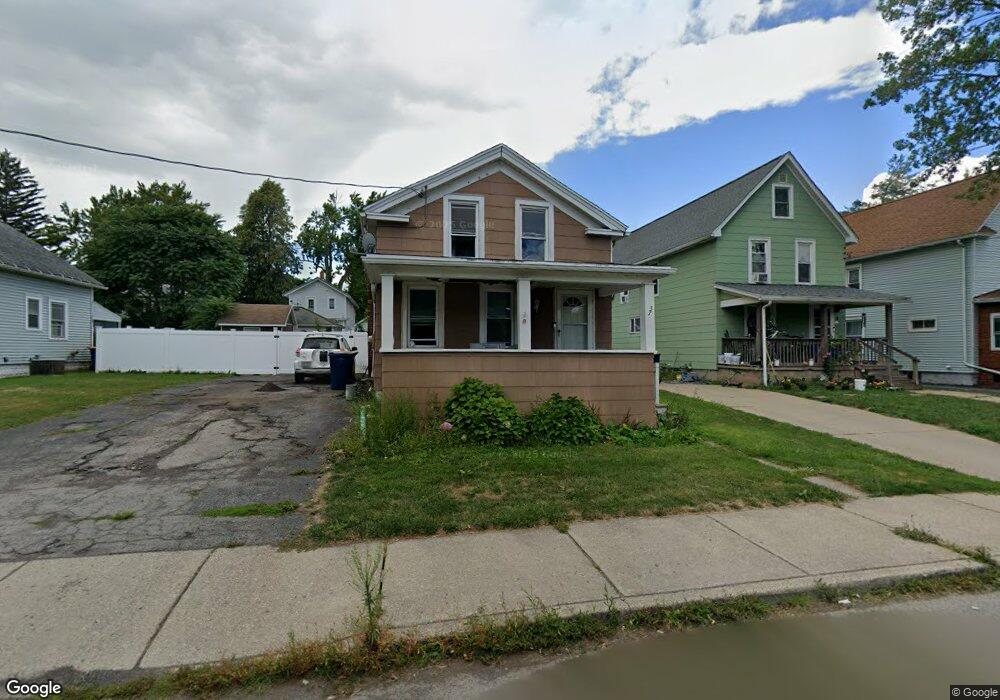
37 Allen St Lockport, NY 14094
Estimated Value: $95,000 - $148,000
3
Beds
1
Bath
1,008
Sq Ft
$114/Sq Ft
Est. Value
About This Home
This home is located at 37 Allen St, Lockport, NY 14094 and is currently estimated at $115,074, approximately $114 per square foot. 37 Allen St is a home located in Niagara County with nearby schools including Aaron Mossell Junior High School, Lockport High School, and DeSales Catholic School.
Ownership History
Date
Name
Owned For
Owner Type
Purchase Details
Closed on
Dec 7, 2012
Sold by
City Of Lockport
Bought by
Holmes Staci
Current Estimated Value
Purchase Details
Closed on
Nov 27, 2012
Sold by
White Michael E
Bought by
Holmes Staci
Purchase Details
Closed on
Nov 14, 2005
Sold by
J & F Property Resource C
Bought by
Kipe Crystal
Home Financials for this Owner
Home Financials are based on the most recent Mortgage that was taken out on this home.
Original Mortgage
$49,900
Interest Rate
6.06%
Mortgage Type
New Conventional
Purchase Details
Closed on
Apr 22, 2005
Sold by
Federal Home Loan Mortgage Corporation
Bought by
J & F Property Resource Corp
Purchase Details
Closed on
Feb 18, 2005
Sold by
Roberts Valery
Bought by
Federal Home Loan Mortgage Corporation
Purchase Details
Closed on
Oct 26, 1994
Sold by
Weyers Wesley R and Weyers Hazel F
Bought by
Bootes Anna M
Create a Home Valuation Report for This Property
The Home Valuation Report is an in-depth analysis detailing your home's value as well as a comparison with similar homes in the area
Home Values in the Area
Average Home Value in this Area
Purchase History
| Date | Buyer | Sale Price | Title Company |
|---|---|---|---|
| Holmes Staci | $10,000 | -- | |
| Holmes Staci | $10,000 | None Available | |
| Kipe Crystal | $49,900 | Gregory Perla | |
| J & F Property Resource Corp | $12,900 | Frank Parlato | |
| Federal Home Loan Mortgage Corporation | $18,541 | Steven Baum | |
| Bootes Anna M | $45,900 | -- |
Source: Public Records
Mortgage History
| Date | Status | Borrower | Loan Amount |
|---|---|---|---|
| Previous Owner | Kipe Crystal | $49,900 |
Source: Public Records
Tax History Compared to Growth
Tax History
| Year | Tax Paid | Tax Assessment Tax Assessment Total Assessment is a certain percentage of the fair market value that is determined by local assessors to be the total taxable value of land and additions on the property. | Land | Improvement |
|---|---|---|---|---|
| 2024 | $2,041 | $76,000 | $4,900 | $71,100 |
| 2023 | $2,041 | $73,000 | $4,900 | $68,100 |
| 2022 | $1,590 | $70,000 | $4,900 | $65,100 |
| 2021 | $1,293 | $32,800 | $3,400 | $29,400 |
| 2020 | $1,266 | $32,800 | $3,400 | $29,400 |
| 2019 | $284 | $32,800 | $3,400 | $29,400 |
| 2018 | $915 | $32,800 | $3,400 | $29,400 |
| 2017 | $173 | $32,800 | $3,400 | $29,400 |
| 2016 | $117 | $32,800 | $3,400 | $29,400 |
| 2015 | -- | $32,800 | $3,400 | $29,400 |
| 2014 | -- | $32,800 | $3,400 | $29,400 |
Source: Public Records
Map
Nearby Homes