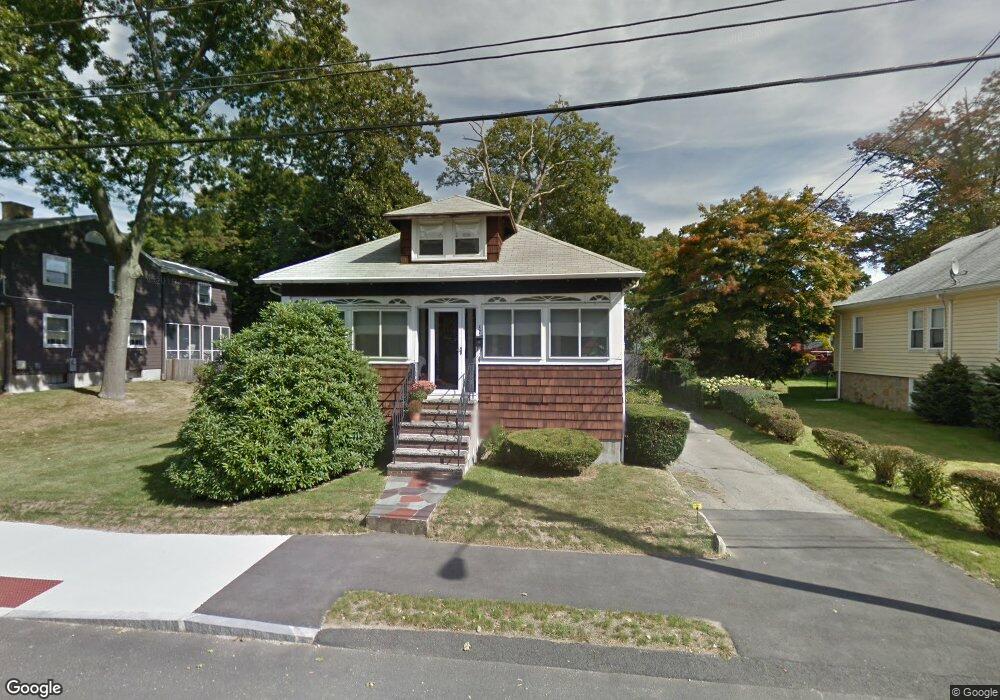
37 Azel Rd Braintree, MA 02184
North Braintree NeighborhoodEstimated Value: $636,000 - $799,000
3
Beds
1
Bath
1,933
Sq Ft
$358/Sq Ft
Est. Value
About This Home
This home is located at 37 Azel Rd, Braintree, MA 02184 and is currently estimated at $691,224, approximately $357 per square foot. 37 Azel Rd is a home located in Norfolk County with nearby schools including Braintree High School, Step Ahead Kindergarten, and Meeting House Montessori School.
Ownership History
Date
Name
Owned For
Owner Type
Purchase Details
Closed on
Oct 29, 2020
Sold by
Roberts Lorraine M
Bought by
Roberts Irt
Current Estimated Value
Purchase Details
Closed on
Aug 18, 1993
Sold by
Roberts Frank J
Bought by
Roberts Frank J and Roberts Lorraine M
Home Financials for this Owner
Home Financials are based on the most recent Mortgage that was taken out on this home.
Original Mortgage
$35,000
Interest Rate
7.11%
Mortgage Type
Purchase Money Mortgage
Create a Home Valuation Report for This Property
The Home Valuation Report is an in-depth analysis detailing your home's value as well as a comparison with similar homes in the area
Home Values in the Area
Average Home Value in this Area
Purchase History
| Date | Buyer | Sale Price | Title Company |
|---|---|---|---|
| Roberts Irt | -- | None Available | |
| Roberts Frank J | $70,000 | -- | |
| Roberts Frank J | $70,000 | -- |
Source: Public Records
Mortgage History
| Date | Status | Borrower | Loan Amount |
|---|---|---|---|
| Previous Owner | Roberts Frank J | $35,000 |
Source: Public Records
Tax History
| Year | Tax Paid | Tax Assessment Tax Assessment Total Assessment is a certain percentage of the fair market value that is determined by local assessors to be the total taxable value of land and additions on the property. | Land | Improvement |
|---|---|---|---|---|
| 2025 | $5,728 | $573,900 | $332,100 | $241,800 |
| 2024 | $5,185 | $546,900 | $309,700 | $237,200 |
| 2023 | $4,954 | $507,600 | $278,300 | $229,300 |
| 2022 | $4,782 | $480,600 | $251,300 | $229,300 |
| 2021 | $4,226 | $424,700 | $227,100 | $197,600 |
| 2020 | $3,906 | $396,100 | $206,400 | $189,700 |
| 2019 | $3,669 | $363,600 | $197,500 | $166,100 |
| 2018 | $3,575 | $339,200 | $179,500 | $159,700 |
| 2017 | $3,546 | $330,200 | $170,500 | $159,700 |
| 2016 | $3,217 | $293,000 | $143,600 | $149,400 |
| 2015 | $3,163 | $285,700 | $141,800 | $143,900 |
| 2014 | $3,120 | $273,200 | $129,300 | $143,900 |
Source: Public Records
Map
Nearby Homes
- 6 Franklin St
- 18 Royal Lake Dr Unit 3
- 5 Woodsum Dr Unit 12
- 145 Hancock St Unit 307
- 145 Hancock St Unit 201
- 491 Washington St Unit 1
- 469-471 Washington St
- 87 Walnut St
- 44 Shepard Rd
- 7 Del's Way
- 418 John Mahar Hwy Unit 408
- 15 Calvin St
- 6 Lunar Ave
- 422 John Mahar Hwy Unit 408
- 47 Addison St
- 426 John Mahar Hwy Unit 311
- 426 John Mahar Hwy Unit 406
- 80 Lake St
- 36 Chestnut Ave
- 50 Cleveland Ave
Your Personal Tour Guide
Ask me questions while you tour the home.