37 Baldwin St Charlestown, MA 02129
Medford Street-The Neck NeighborhoodEstimated Value: $1,594,000 - $1,868,333
5
Beds
4
Baths
2,243
Sq Ft
$796/Sq Ft
Est. Value
About This Home
This home is located at 37 Baldwin St, Charlestown, MA 02129 and is currently estimated at $1,784,833, approximately $795 per square foot. 37 Baldwin St is a home located in Suffolk County with nearby schools including Prospect Hill Academy Upper Elementary Campus and Bright Future Educare Center.
Ownership History
Date
Name
Owned For
Owner Type
Purchase Details
Closed on
May 1, 2000
Sold by
Hennessy Michael E and Hennessey Diane M
Bought by
Basta Leo L
Current Estimated Value
Home Financials for this Owner
Home Financials are based on the most recent Mortgage that was taken out on this home.
Original Mortgage
$299,200
Interest Rate
8.23%
Mortgage Type
Purchase Money Mortgage
Purchase Details
Closed on
Apr 28, 1998
Sold by
Corwin Mark and Corwin Joann E
Bought by
Hennessy Michael E and Hennessy Diane M
Purchase Details
Closed on
Mar 31, 1992
Sold by
Mcgonagle Virginia and Mcgonagle Shelly
Bought by
Corwin Mark and Corwin Joanne E
Purchase Details
Closed on
Dec 11, 1987
Sold by
Mele Anthony P
Bought by
Mcgonagle Virginia M
Create a Home Valuation Report for This Property
The Home Valuation Report is an in-depth analysis detailing your home's value as well as a comparison with similar homes in the area
Home Values in the Area
Average Home Value in this Area
Purchase History
| Date | Buyer | Sale Price | Title Company |
|---|---|---|---|
| Basta Leo L | $374,000 | -- | |
| Hennessy Michael E | $200,000 | -- | |
| Corwin Mark | $153,750 | -- | |
| Mcgonagle Virginia M | $175,000 | -- |
Source: Public Records
Mortgage History
| Date | Status | Borrower | Loan Amount |
|---|---|---|---|
| Open | Mcgonagle Virginia M | $332,500 | |
| Closed | Mcgonagle Virginia M | $299,200 |
Source: Public Records
Tax History Compared to Growth
Tax History
| Year | Tax Paid | Tax Assessment Tax Assessment Total Assessment is a certain percentage of the fair market value that is determined by local assessors to be the total taxable value of land and additions on the property. | Land | Improvement |
|---|---|---|---|---|
| 2025 | $16,935 | $1,462,400 | $333,900 | $1,128,500 |
| 2024 | $15,715 | $1,441,700 | $246,700 | $1,195,000 |
| 2023 | $14,747 | $1,373,100 | $234,900 | $1,138,200 |
| 2022 | $13,582 | $1,248,300 | $213,600 | $1,034,700 |
| 2021 | $13,031 | $1,221,300 | $209,400 | $1,011,900 |
| 2020 | $11,830 | $1,120,300 | $196,900 | $923,400 |
| 2019 | $11,571 | $1,097,800 | $157,500 | $940,300 |
| 2018 | $10,857 | $1,036,000 | $157,500 | $878,500 |
| 2017 | $8,143 | $768,960 | $126,000 | $642,960 |
| 2016 | $6,894 | $626,700 | $157,500 | $469,200 |
| 2015 | $7,094 | $585,800 | $176,700 | $409,100 |
| 2014 | $6,505 | $517,100 | $176,700 | $340,400 |
Source: Public Records
Map
Nearby Homes
- 9 Armory St
- 364 Bunker Hill St Unit 1
- 9 Short St
- 40 Mead St Unit 3
- 100 Baldwin St Unit 1
- 40 Chappie St Unit 1
- 29 Eden St Unit 3
- 24 N Mead St
- 64 Walker St Unit 66
- 270 Bunker Hill St Unit 4
- 56 Belmont St Unit 1
- 15 Russell St
- 9 Russell St Unit 2
- 9 Russell St Unit 1
- 255 Bunker Hill St Unit 2
- 247 Bunker Hill St Unit A
- 24 Brighton St
- 19 Parker St Unit 3
- 207 Bunker Hill St Unit 2
- 39 Mount Pleasant St
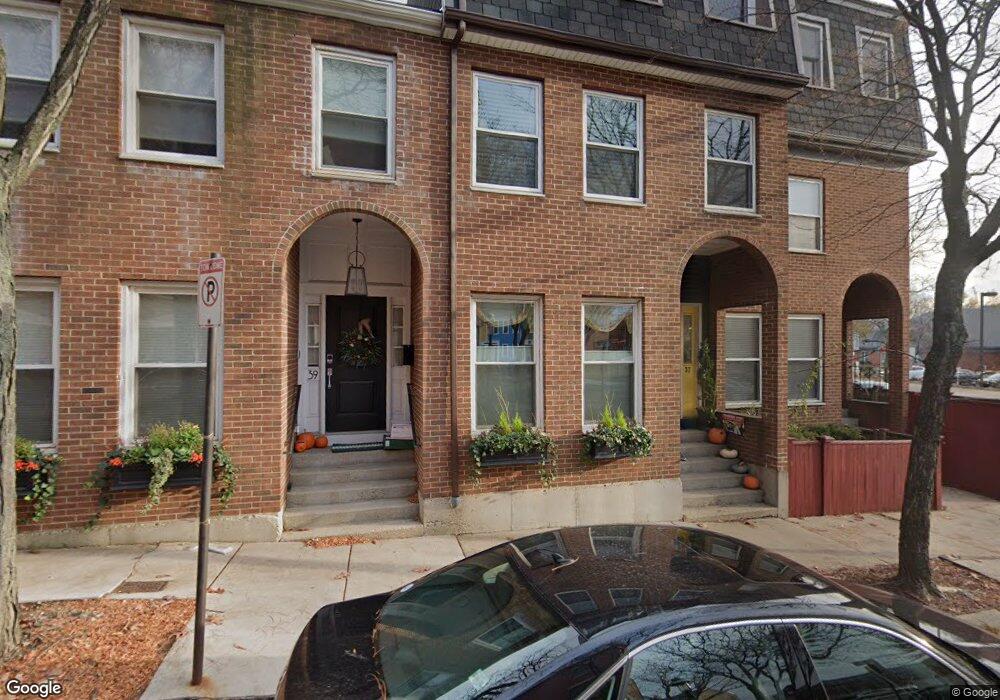
- 39 Baldwin St
- 39 Baldwin St Unit 1
- 35 Baldwin St
- 41 Baldwin St
- 433 Main St
- 429 Main St
- 43 Baldwin St Unit 43
- 435 1/2 Main St
- 425 Main St
- 435 Main St 3rd Flr Unit Unit R2
- 435 Main St 2nd Flr Unit Unit 2nd floor
- 435 Main St 3rd Flr Unit Unit 3rd floor
- 45 Baldwin St Unit 3
- 45 Baldwin St Unit 2
- 45 Baldwin St Unit A
- 45 Baldwin St
- 435 Main St Unit 1
- 435 Main St Unit 1
- 435 Main St Unit 1
- 437 Main St Unit 1