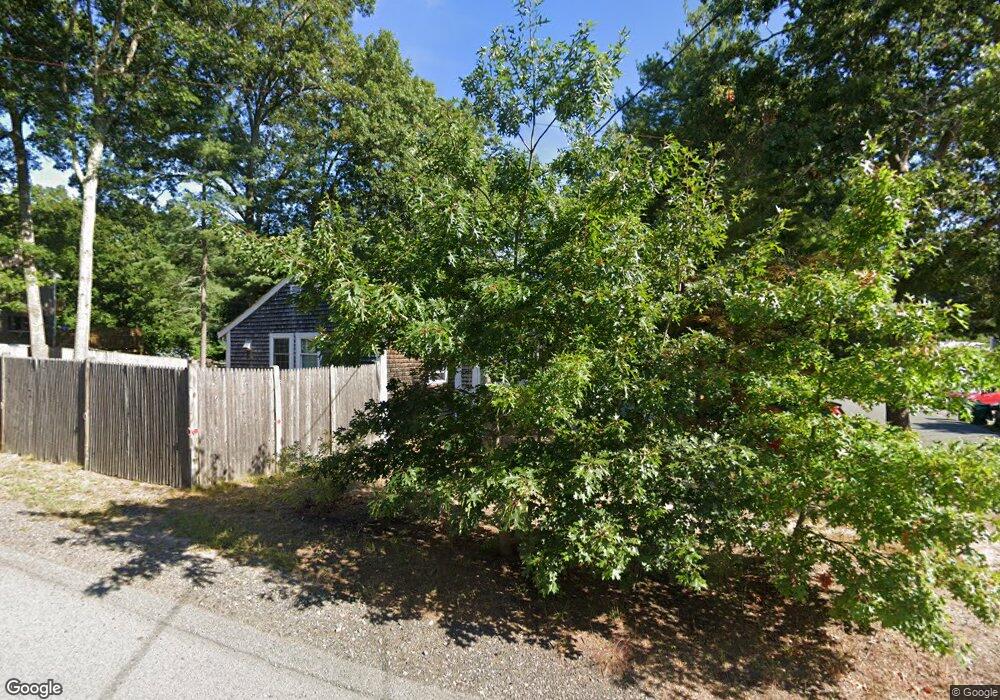
37 Beachway Pembroke, MA 02359
Estimated Value: $620,745 - $770,000
3
Beds
2
Baths
2,685
Sq Ft
$249/Sq Ft
Est. Value
About This Home
This home is located at 37 Beachway, Pembroke, MA 02359 and is currently estimated at $667,436, approximately $248 per square foot. 37 Beachway is a home located in Plymouth County with nearby schools including Pembroke High School.
Ownership History
Date
Name
Owned For
Owner Type
Purchase Details
Closed on
May 3, 2001
Sold by
Fitzgerald Kevinp and Fitzgerald Christine M
Bought by
Ogilvie Richard and Ogilvie Kerry A
Current Estimated Value
Purchase Details
Closed on
Apr 27, 2000
Sold by
Bonneau David A and Bonneau Lisa J
Bought by
Fitzgerald Kevin P and Fitzgerald Christine M
Purchase Details
Closed on
Apr 8, 1991
Sold by
Citicorp Mtg Inc
Bought by
Bonneau David A and Tetanski Lisa J
Purchase Details
Closed on
Jan 16, 1991
Sold by
Hathaway Kevin and Hathaway Jeanne L
Bought by
Citicorp Mtg Inc
Create a Home Valuation Report for This Property
The Home Valuation Report is an in-depth analysis detailing your home's value as well as a comparison with similar homes in the area
Home Values in the Area
Average Home Value in this Area
Purchase History
| Date | Buyer | Sale Price | Title Company |
|---|---|---|---|
| Ogilvie Richard | $237,000 | -- | |
| Fitzgerald Kevin P | $215,000 | -- | |
| Bonneau David A | $130,000 | -- | |
| Citicorp Mtg Inc | $110,600 | -- |
Source: Public Records
Mortgage History
| Date | Status | Borrower | Loan Amount |
|---|---|---|---|
| Open | Citicorp Mtg Inc | $236,000 | |
| Closed | Citicorp Mtg Inc | $30,000 |
Source: Public Records
Tax History Compared to Growth
Tax History
| Year | Tax Paid | Tax Assessment Tax Assessment Total Assessment is a certain percentage of the fair market value that is determined by local assessors to be the total taxable value of land and additions on the property. | Land | Improvement |
|---|---|---|---|---|
| 2025 | $6,232 | $518,500 | $247,600 | $270,900 |
| 2024 | $5,904 | $490,800 | $222,200 | $268,600 |
| 2023 | $5,751 | $452,100 | $222,200 | $229,900 |
| 2022 | $5,452 | $385,300 | $181,800 | $203,500 |
| 2021 | $5,272 | $361,600 | $173,400 | $188,200 |
| 2020 | $5,077 | $350,400 | $165,700 | $184,700 |
| 2019 | $4,922 | $337,100 | $161,500 | $175,600 |
| 2018 | $4,473 | $300,400 | $142,400 | $158,000 |
| 2017 | $4,409 | $292,000 | $134,700 | $157,300 |
| 2016 | $4,337 | $284,200 | $127,000 | $157,200 |
| 2015 | $4,040 | $274,100 | $115,300 | $158,800 |
Source: Public Records
Map
Nearby Homes