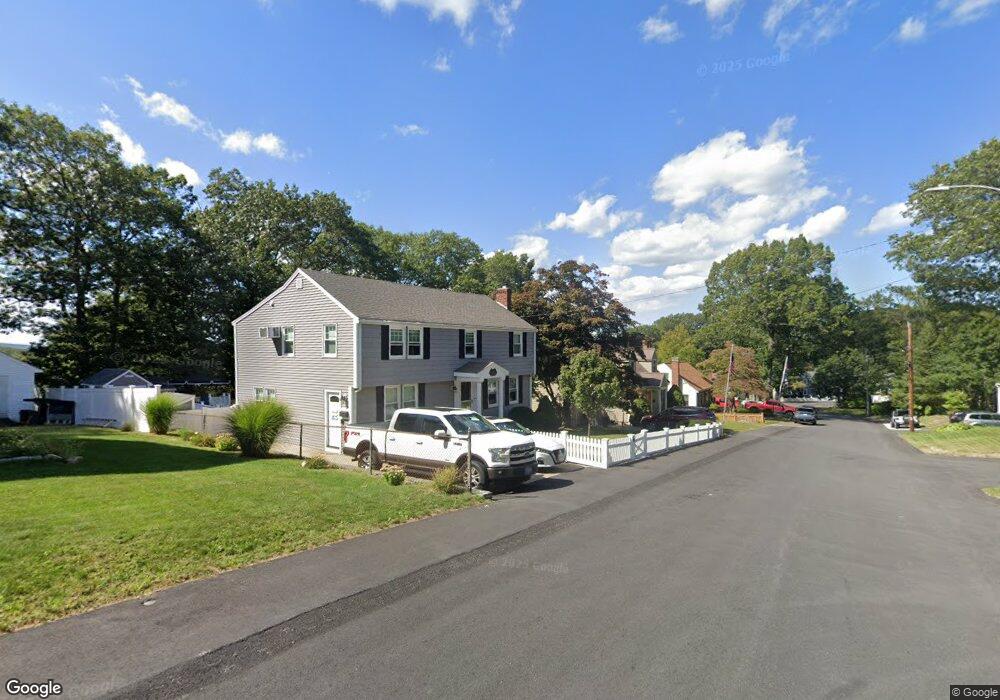
37 Belmont St Weymouth, MA 02188
South Weymouth NeighborhoodEstimated Value: $718,127 - $779,000
4
Beds
3
Baths
2,500
Sq Ft
$299/Sq Ft
Est. Value
About This Home
This home is located at 37 Belmont St, Weymouth, MA 02188 and is currently estimated at $748,032, approximately $299 per square foot. 37 Belmont St is a home located in Norfolk County with nearby schools including Frederick C Murphy, Abigail Adams Middle School, and Weymouth Middle School Chapman.
Ownership History
Date
Name
Owned For
Owner Type
Purchase Details
Closed on
Sep 25, 2020
Sold by
Gorham Harriet M
Bought by
Hanley Paul F and Hanley Katherine
Current Estimated Value
Home Financials for this Owner
Home Financials are based on the most recent Mortgage that was taken out on this home.
Original Mortgage
$470,000
Outstanding Balance
$418,040
Interest Rate
2.9%
Mortgage Type
New Conventional
Estimated Equity
$329,992
Create a Home Valuation Report for This Property
The Home Valuation Report is an in-depth analysis detailing your home's value as well as a comparison with similar homes in the area
Home Values in the Area
Average Home Value in this Area
Purchase History
| Date | Buyer | Sale Price | Title Company |
|---|---|---|---|
| Hanley Paul F | $550,000 | None Available |
Source: Public Records
Mortgage History
| Date | Status | Borrower | Loan Amount |
|---|---|---|---|
| Open | Hanley Paul F | $470,000 |
Source: Public Records
Tax History Compared to Growth
Tax History
| Year | Tax Paid | Tax Assessment Tax Assessment Total Assessment is a certain percentage of the fair market value that is determined by local assessors to be the total taxable value of land and additions on the property. | Land | Improvement |
|---|---|---|---|---|
| 2025 | $6,481 | $641,700 | $241,300 | $400,400 |
| 2024 | $6,275 | $611,000 | $229,800 | $381,200 |
| 2023 | $5,762 | $551,400 | $212,800 | $338,600 |
| 2022 | $5,477 | $477,900 | $180,700 | $297,200 |
| 2021 | $5,371 | $457,500 | $180,700 | $276,800 |
| 2020 | $5,183 | $434,800 | $180,700 | $254,100 |
| 2019 | $5,096 | $420,500 | $173,700 | $246,800 |
| 2018 | $4,969 | $397,500 | $165,400 | $232,100 |
| 2017 | $4,811 | $375,600 | $157,600 | $218,000 |
| 2016 | $4,666 | $364,500 | $151,500 | $213,000 |
| 2015 | $4,369 | $338,700 | $144,600 | $194,100 |
| 2014 | $4,257 | $320,100 | $134,600 | $185,500 |
Source: Public Records
Map
Nearby Homes
- 116 Belmont St
- 501 Commerce Dr Unit 2310
- 501 Commerce Dr Unit 1111
- 501 Commerce Dr Unit 4206
- 501 Commerce Dr Unit 4308
- 501 Commerce Dr Unit 4306
- 655 Summer St
- 200 Justin Dr Unit 3
- 255 West St
- 262 West St
- 92 Mercury St
- 432 Grove St
- 441 Grove St
- 48 Apple Tree Ln
- 972 Liberty St
- 67 Abby Rd
- 54 Federal St
- 24 Blake Rd
- 2 Tara Dr Unit 1
- 308 Forest St