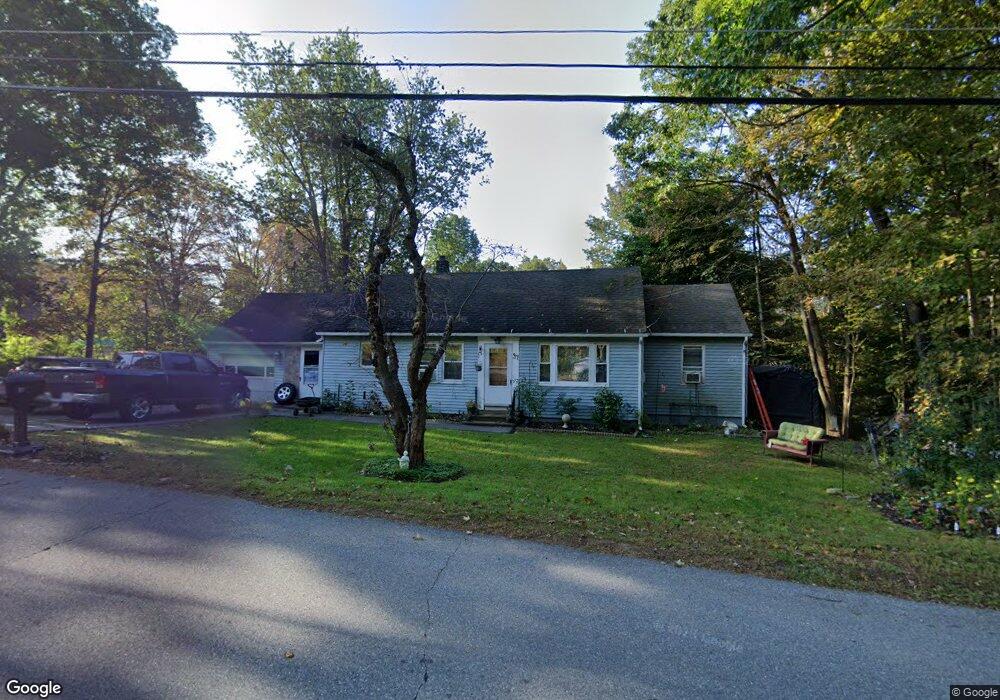
37 Bigelow St North Brookfield, MA 01535
Estimated Value: $309,000 - $319,000
2
Beds
1
Bath
1,092
Sq Ft
$286/Sq Ft
Est. Value
About This Home
This home is located at 37 Bigelow St, North Brookfield, MA 01535 and is currently estimated at $312,026, approximately $285 per square foot. 37 Bigelow St is a home located in Worcester County with nearby schools including North Brookfield Elementary School and North Brookfield High School.
Ownership History
Date
Name
Owned For
Owner Type
Purchase Details
Closed on
Jun 24, 2008
Sold by
Lewis E E and Lewis Lois E
Bought by
Wuelfing Bethany E
Current Estimated Value
Home Financials for this Owner
Home Financials are based on the most recent Mortgage that was taken out on this home.
Original Mortgage
$157,500
Outstanding Balance
$98,655
Interest Rate
6.1%
Mortgage Type
Purchase Money Mortgage
Estimated Equity
$213,371
Purchase Details
Closed on
Jun 10, 1991
Sold by
Varnum Robert C and Varnum Dorothy
Bought by
King Lewis E and King Lois E
Create a Home Valuation Report for This Property
The Home Valuation Report is an in-depth analysis detailing your home's value as well as a comparison with similar homes in the area
Home Values in the Area
Average Home Value in this Area
Purchase History
| Date | Buyer | Sale Price | Title Company |
|---|---|---|---|
| Wuelfing Bethany E | $162,500 | -- | |
| King Lewis E | $100,000 | -- |
Source: Public Records
Mortgage History
| Date | Status | Borrower | Loan Amount |
|---|---|---|---|
| Open | Wuelfing Bethany E | $157,500 |
Source: Public Records
Tax History
| Year | Tax Paid | Tax Assessment Tax Assessment Total Assessment is a certain percentage of the fair market value that is determined by local assessors to be the total taxable value of land and additions on the property. | Land | Improvement |
|---|---|---|---|---|
| 2025 | $3,347 | $236,200 | $63,400 | $172,800 |
| 2024 | $2,991 | $227,800 | $62,900 | $164,900 |
| 2023 | $2,824 | $211,400 | $57,000 | $154,400 |
| 2022 | $2,691 | $181,100 | $47,000 | $134,100 |
| 2021 | $2,377 | $151,000 | $45,700 | $105,300 |
| 2019 | $2,462 | $145,000 | $46,100 | $98,900 |
| 2018 | $2,417 | $145,000 | $46,100 | $98,900 |
| 2017 | $2,387 | $144,400 | $57,600 | $86,800 |
| 2016 | $2,336 | $144,400 | $57,600 | $86,800 |
| 2015 | $2,270 | $145,600 | $58,800 | $86,800 |
| 2014 | $2,219 | $145,600 | $58,800 | $86,800 |
Source: Public Records
Map
Nearby Homes
Your Personal Tour Guide
Ask me questions while you tour the home.