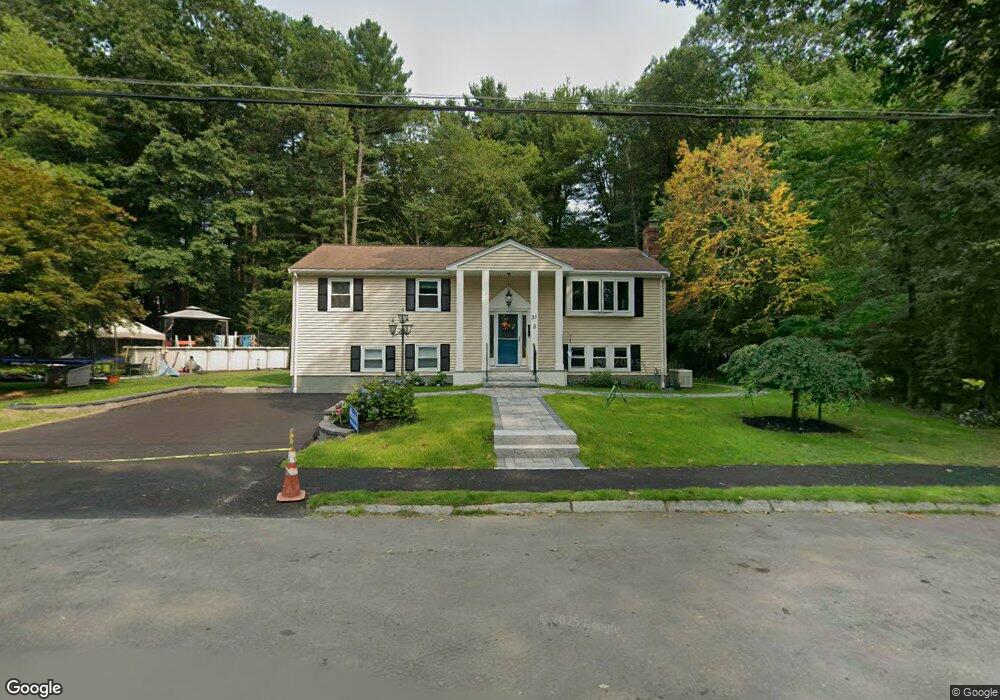
37 Borrows Rd Foxboro, MA 02035
Estimated Value: $703,614 - $774,000
3
Beds
4
Baths
1,500
Sq Ft
$500/Sq Ft
Est. Value
About This Home
This home is located at 37 Borrows Rd, Foxboro, MA 02035 and is currently estimated at $749,404, approximately $499 per square foot. 37 Borrows Rd is a home located in Norfolk County with nearby schools including Foxborough High School, Hands-On-Montessori School, and Discovery Daycare Center.
Ownership History
Date
Name
Owned For
Owner Type
Purchase Details
Closed on
Aug 16, 2018
Sold by
White Sharon M
Bought by
White Sharon M
Current Estimated Value
Purchase Details
Closed on
May 28, 1992
Sold by
Moen Phillip T and Moen Catherine E
Bought by
White Gerard F and White Sharon M
Home Financials for this Owner
Home Financials are based on the most recent Mortgage that was taken out on this home.
Original Mortgage
$50,000
Interest Rate
8.7%
Mortgage Type
Purchase Money Mortgage
Create a Home Valuation Report for This Property
The Home Valuation Report is an in-depth analysis detailing your home's value as well as a comparison with similar homes in the area
Home Values in the Area
Average Home Value in this Area
Purchase History
| Date | Buyer | Sale Price | Title Company |
|---|---|---|---|
| White Sharon M | -- | -- | |
| White Gerard F | $156,500 | -- |
Source: Public Records
Mortgage History
| Date | Status | Borrower | Loan Amount |
|---|---|---|---|
| Previous Owner | White Gerard F | $200,000 | |
| Previous Owner | White Gerard F | $50,000 |
Source: Public Records
Tax History Compared to Growth
Tax History
| Year | Tax Paid | Tax Assessment Tax Assessment Total Assessment is a certain percentage of the fair market value that is determined by local assessors to be the total taxable value of land and additions on the property. | Land | Improvement |
|---|---|---|---|---|
| 2025 | $8,775 | $663,800 | $243,300 | $420,500 |
| 2024 | $8,449 | $625,400 | $247,800 | $377,600 |
| 2023 | $8,203 | $577,300 | $235,900 | $341,400 |
| 2022 | $7,532 | $518,700 | $197,800 | $320,900 |
| 2021 | $7,062 | $479,100 | $183,100 | $296,000 |
| 2020 | $6,562 | $450,400 | $183,100 | $267,300 |
| 2019 | $6,475 | $440,500 | $174,400 | $266,100 |
| 2018 | $5,171 | $354,900 | $174,400 | $180,500 |
| 2017 | $5,049 | $335,700 | $163,000 | $172,700 |
| 2016 | $5,111 | $344,900 | $164,400 | $180,500 |
| 2015 | $4,899 | $322,500 | $139,000 | $183,500 |
| 2014 | $4,698 | $313,400 | $129,900 | $183,500 |
Source: Public Records
Map
Nearby Homes
- 24 Maverick Dr
- 16 Treasure Island Rd
- 85 Jewell St
- 93 Plain St
- 46 Mirimichi St
- 9 Oak Dr
- 78 Old Farm Rd
- 150 Gilbert St
- 116 George St
- 14 Claire Ave
- 356 Central St
- 155 South St
- 152 Central St
- 166 Chauncy St
- 12 Spring St
- 73-75 Draper Ave
- 28 Messenger St
- 126 Washington St
- 130 Washington St
- 124 Washington St