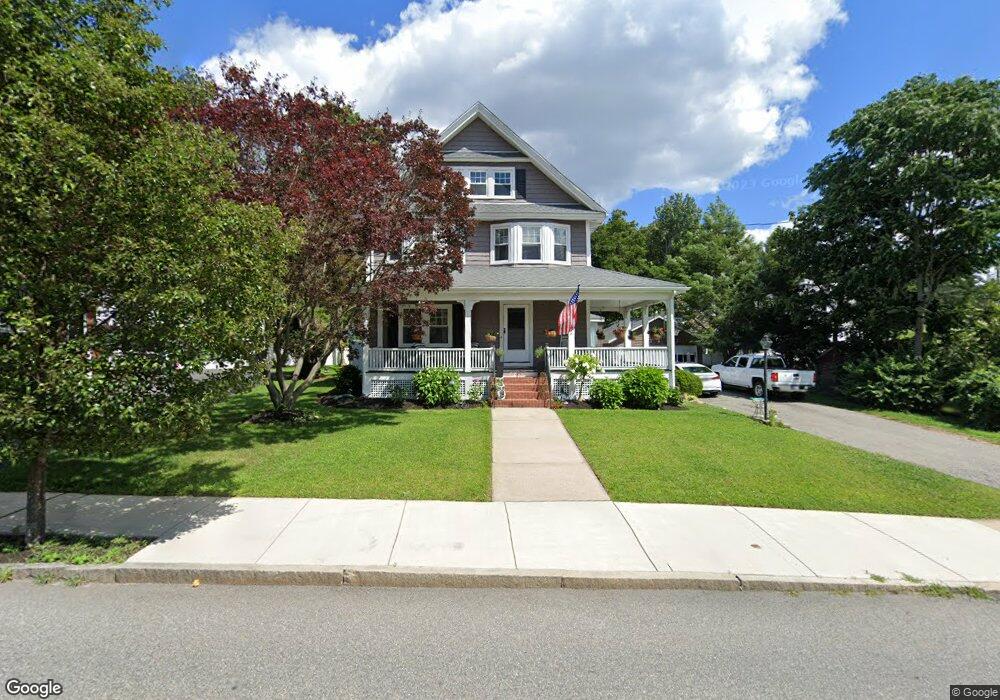
37 Bow St Woburn, MA 01801
Downtown Woburn NeighborhoodEstimated Value: $793,000 - $857,000
2
Beds
2
Baths
1,890
Sq Ft
$433/Sq Ft
Est. Value
About This Home
This home is located at 37 Bow St, Woburn, MA 01801 and is currently estimated at $818,558, approximately $433 per square foot. 37 Bow St is a home located in Middlesex County with nearby schools including Malcolm White Elementary School, John F. Kennedy Middle School, and Woburn High School.
Ownership History
Date
Name
Owned For
Owner Type
Purchase Details
Closed on
Apr 23, 2009
Sold by
Josephine J Mahoney T J and Josephine Mahoney
Bought by
Mahoney Richard J and Mahoney Jennifer H
Current Estimated Value
Home Financials for this Owner
Home Financials are based on the most recent Mortgage that was taken out on this home.
Original Mortgage
$248,000
Interest Rate
4.93%
Mortgage Type
Purchase Money Mortgage
Purchase Details
Closed on
Dec 8, 2006
Sold by
Mahoney Josephine J
Bought by
Josephine J Mahoney 2 and Mahoney
Create a Home Valuation Report for This Property
The Home Valuation Report is an in-depth analysis detailing your home's value as well as a comparison with similar homes in the area
Home Values in the Area
Average Home Value in this Area
Purchase History
We collect this data history from publicly available records. To have your information removed, we recommend requesting removal directly through your county’s website.
| Date | Buyer | Sale Price | Title Company |
|---|---|---|---|
| Mahoney Richard J | $255,000 | -- | |
| Mahoney Richard J | $255,000 | -- | |
| Josephine J Mahoney 2 | -- | -- | |
| Josephine J Mahoney 2 | -- | -- |
Source: Public Records
Mortgage History
We collect this data history from publicly available records. To have your information removed, we recommend requesting removal directly through your county’s website.
| Date | Status | Borrower | Loan Amount |
|---|---|---|---|
| Open | Josephine J Mahoney 2 | $320,000 | |
| Closed | Josephine J Mahoney 2 | $50,000 | |
| Closed | Mahoney Richard J | $248,000 |
Source: Public Records
Tax History
| Year | Tax Paid | Tax Assessment Tax Assessment Total Assessment is a certain percentage of the fair market value that is determined by local assessors to be the total taxable value of land and additions on the property. | Land | Improvement |
|---|---|---|---|---|
| 2025 | $6,320 | $740,000 | $336,800 | $403,200 |
| 2024 | $5,616 | $696,800 | $320,800 | $376,000 |
| 2023 | $5,667 | $651,400 | $291,700 | $359,700 |
| 2022 | $5,459 | $584,500 | $253,900 | $330,600 |
| 2021 | $5,004 | $536,300 | $241,900 | $294,400 |
| 2020 | $4,981 | $534,400 | $241,900 | $292,500 |
| 2019 | $4,905 | $516,300 | $230,500 | $285,800 |
| 2018 | $4,612 | $466,300 | $211,600 | $254,700 |
| 2017 | $4,352 | $437,800 | $201,700 | $236,100 |
| 2016 | $4,159 | $413,800 | $188,600 | $225,200 |
| 2015 | $4,011 | $394,400 | $176,400 | $218,000 |
| 2014 | $3,890 | $372,600 | $176,400 | $196,200 |
Source: Public Records
Map
Nearby Homes
- 18 Sherman Place
- 5 Ingalls St
- 6 Packard St
- 28 Everett St
- 14 Church Ave
- 477 Main St
- 219 Montvale Ae
- 69r Eastern Ave
- 164 Green St
- 35 Montvale Ave Unit 3
- 31 Montvale Ave Unit 2
- 605 Main St
- 7 Prospect St
- 22 Franklin St
- 27 Park St
- 0 Fryeburg Rd
- 0 Mount Pleasant St
- 166 Place Ln Unit 166
- 321 Place Ln
- 87 Winn St Unit 1
Your Personal Tour Guide
Ask me questions while you tour the home.