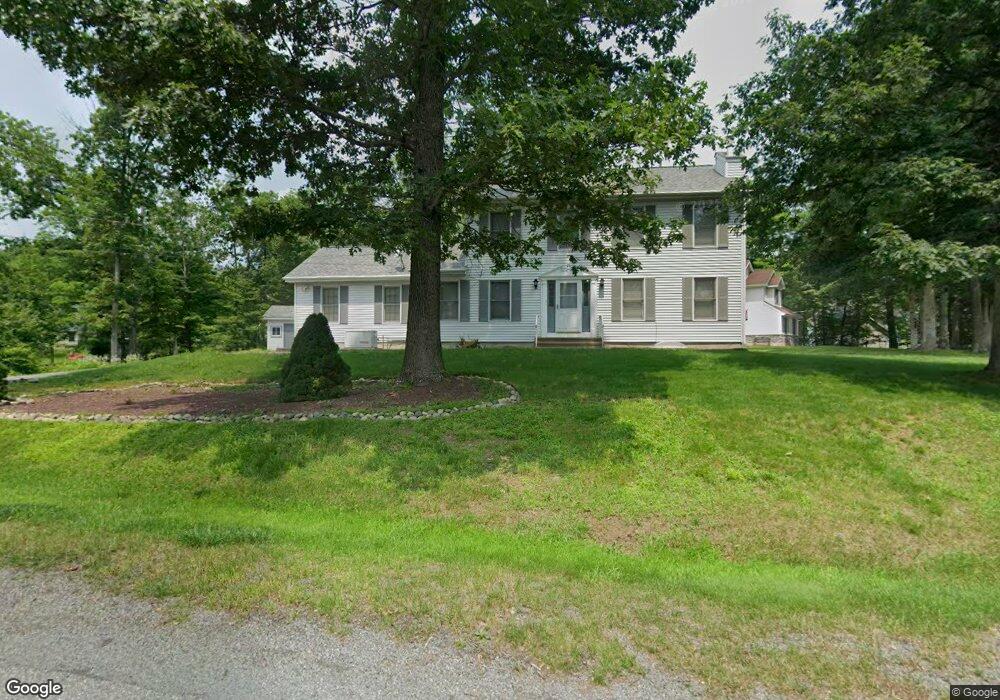
37 Brook Song Way East Stroudsburg, PA 18301
Estimated Value: $392,288 - $468,000
3
Beds
3
Baths
2,400
Sq Ft
$181/Sq Ft
Est. Value
About This Home
This home is located at 37 Brook Song Way, East Stroudsburg, PA 18301 and is currently estimated at $433,572, approximately $180 per square foot. 37 Brook Song Way is a home located in Monroe County with nearby schools including Smithfield Elementary School, J.T. Lambert Intermediate School, and East Stroudsburg Senior High School South.
Ownership History
Date
Name
Owned For
Owner Type
Purchase Details
Closed on
May 27, 2016
Sold by
Montalvo Carmen R and Nieves Rhianna
Bought by
Nieves Rhianna
Current Estimated Value
Purchase Details
Closed on
May 18, 2015
Sold by
Nieves Rhianna
Bought by
Montalvo Carmen R and Nieves Rhianna
Home Financials for this Owner
Home Financials are based on the most recent Mortgage that was taken out on this home.
Original Mortgage
$141,900
Interest Rate
3.68%
Mortgage Type
New Conventional
Purchase Details
Closed on
Mar 19, 2015
Sold by
Seney Carmen R and Nieves Rhianna
Bought by
Nieves Rhianna
Home Financials for this Owner
Home Financials are based on the most recent Mortgage that was taken out on this home.
Original Mortgage
$141,900
Interest Rate
3.68%
Mortgage Type
New Conventional
Create a Home Valuation Report for This Property
The Home Valuation Report is an in-depth analysis detailing your home's value as well as a comparison with similar homes in the area
Home Values in the Area
Average Home Value in this Area
Purchase History
| Date | Buyer | Sale Price | Title Company |
|---|---|---|---|
| Nieves Rhianna | -- | None Available | |
| Montalvo Carmen R | -- | None Available | |
| Nieves Rhianna | -- | Nationallink |
Source: Public Records
Mortgage History
| Date | Status | Borrower | Loan Amount |
|---|---|---|---|
| Previous Owner | Nieves Rhianna | $141,900 |
Source: Public Records
Tax History Compared to Growth
Tax History
| Year | Tax Paid | Tax Assessment Tax Assessment Total Assessment is a certain percentage of the fair market value that is determined by local assessors to be the total taxable value of land and additions on the property. | Land | Improvement |
|---|---|---|---|---|
| 2025 | $1,387 | $167,050 | $24,540 | $142,510 |
| 2024 | $1,142 | $167,050 | $24,540 | $142,510 |
| 2023 | $5,932 | $167,050 | $24,540 | $142,510 |
| 2022 | $5,925 | $167,050 | $24,540 | $142,510 |
| 2021 | $5,802 | $167,050 | $24,540 | $142,510 |
| 2020 | $5,451 | $167,050 | $24,540 | $142,510 |
| 2019 | $7,717 | $37,790 | $9,500 | $28,290 |
| 2018 | $7,717 | $37,790 | $9,500 | $28,290 |
| 2017 | $7,717 | $37,790 | $9,500 | $28,290 |
| 2016 | $7,290 | $37,790 | $9,500 | $28,290 |
| 2015 | -- | $37,790 | $9,500 | $28,290 |
| 2014 | -- | $37,790 | $9,500 | $28,290 |
Source: Public Records
Map
Nearby Homes
- 7 Brahms Ct
- 121 Truman Rd
- 1104 Buttermilk Falls Rd
- 127 Stoneleigh Dr
- 155 Kimberleigh Ct
- 125 Stoneleigh Dr
- 1139 Old Mill Rd
- 128 Manor Dr
- 167 Independence Rd
- 0 State Road 447 Independence Rd Unit PAMR2004674
- 0 State Road 447 Independence Rd Unit PAMR2004682
- 137 Independence Rd
- 965 Mckinley Way
- 611 Mckinley Way
- 507 Mckinley Way
- 0 Mckinley Way
- 121 Tree Ln
- 709 Kennedy Ct
- 707 Kennedy Ct
- 309 Arthur Ave
- 82 Symphony Cir
- 35 Brook Song Way
- 36 Brook Song Way
- 83 Symphony Cir
- 38 Brook Song Way
- 80 Symphony Cir
- 33 Brook Song Way
- 34 Brook Song Way
- 94 Woodwind Ct
- 81 Symphony Cir
- 96 Woodwind Ct
- 40 Brook Song Way
- 92 Woodwind Ct
- 78 Symphony Cir
- 32 Brook Song Way
- 31 Brook Song Way
- 30 Brook Song Way
- 45 Brook Song Way
- 79 Symphony Cir
- 77 Symphony Cir