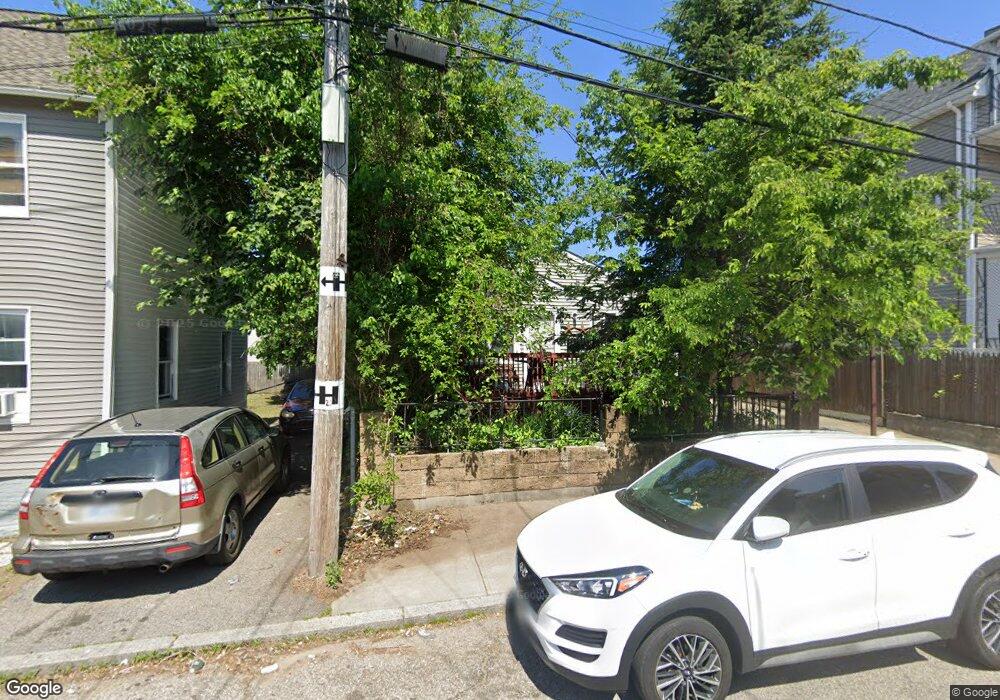
37 Calder St Providence, RI 02907
West End NeighborhoodEstimated Value: $324,000 - $365,000
3
Beds
1
Bath
966
Sq Ft
$361/Sq Ft
Est. Value
About This Home
This home is located at 37 Calder St, Providence, RI 02907 and is currently estimated at $349,056, approximately $361 per square foot. 37 Calder St is a home located in Providence County with nearby schools including Highlander Charter School, Paul Cuffee High School, and Sophia Academy.
Ownership History
Date
Name
Owned For
Owner Type
Purchase Details
Closed on
Jun 22, 1998
Sold by
Garcia Samuel and Garcia Maritza
Bought by
Figueroa Ignacio
Current Estimated Value
Purchase Details
Closed on
May 28, 1993
Sold by
Fairlawn Cu
Bought by
Garcia Samuel and Garcia Maritza
Create a Home Valuation Report for This Property
The Home Valuation Report is an in-depth analysis detailing your home's value as well as a comparison with similar homes in the area
Home Values in the Area
Average Home Value in this Area
Purchase History
| Date | Buyer | Sale Price | Title Company |
|---|---|---|---|
| Figueroa Ignacio | $75,000 | -- | |
| Garcia Samuel | $40,000 | -- |
Source: Public Records
Mortgage History
| Date | Status | Borrower | Loan Amount |
|---|---|---|---|
| Open | Garcia Samuel | $138,000 | |
| Closed | Garcia Samuel | $10,600 | |
| Closed | Garcia Samuel | $122,000 |
Source: Public Records
Tax History
| Year | Tax Paid | Tax Assessment Tax Assessment Total Assessment is a certain percentage of the fair market value that is determined by local assessors to be the total taxable value of land and additions on the property. | Land | Improvement |
|---|---|---|---|---|
| 2025 | $2,264 | $269,500 | $106,900 | $162,600 |
| 2024 | $3,898 | $212,400 | $71,300 | $141,100 |
| 2023 | $3,898 | $212,400 | $71,300 | $141,100 |
| 2022 | $3,781 | $212,400 | $71,300 | $141,100 |
| 2021 | $3,249 | $132,300 | $33,200 | $99,100 |
| 2020 | $3,249 | $132,300 | $33,200 | $99,100 |
| 2019 | $3,249 | $132,300 | $33,200 | $99,100 |
| 2018 | $3,413 | $106,800 | $32,900 | $73,900 |
| 2017 | $3,413 | $106,800 | $32,900 | $73,900 |
| 2016 | $3,413 | $106,800 | $32,900 | $73,900 |
| 2015 | $3,224 | $97,400 | $32,900 | $64,500 |
| 2014 | $3,287 | $97,400 | $32,900 | $64,500 |
| 2013 | $3,287 | $97,400 | $32,900 | $64,500 |
Source: Public Records
Map
Nearby Homes
- 40 Calder St
- 523 Dexter St
- 690 Potters Ave
- 14 Seabury St
- 10 Seabury St
- 13 Halton St
- 10 Calhoun Ave
- 775 Potters Ave Unit 3
- 199 Linwood Ave
- 183 Congress Ave
- 131 Mitchell St
- 44 Puritan St
- 654 Cranston St
- 217 Elmwood Ave
- 61 Stanwood St
- 91 Peace St
- 61 Whitmarsh St
- 206 Hanover St
- 33 Ford St
- 182 Adelaide Ave Unit 2
Your Personal Tour Guide
Ask me questions while you tour the home.