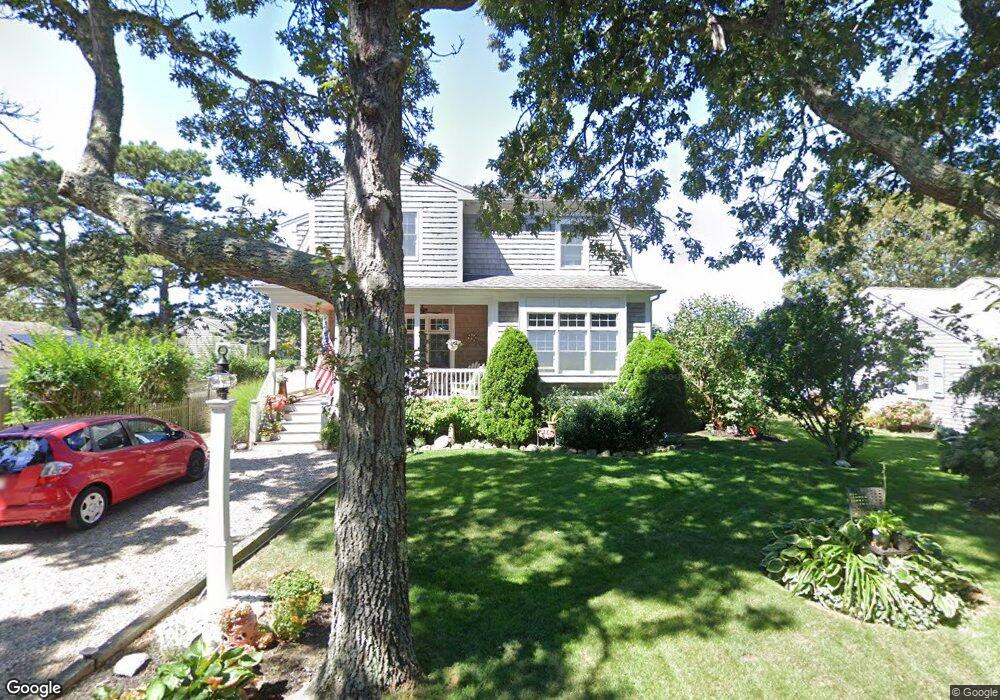
37 Caleb St Dennis Port, MA 2639
Dennis Port NeighborhoodEstimated Value: $1,139,610 - $1,316,000
3
Beds
2
Baths
2,600
Sq Ft
$468/Sq Ft
Est. Value
About This Home
This home is located at 37 Caleb St, Dennis Port, MA 2639 and is currently estimated at $1,217,403, approximately $468 per square foot. 37 Caleb St is a home located in Barnstable County with nearby schools including Dennis-Yarmouth Regional High School and St. Pius X. School.
Ownership History
Date
Name
Owned For
Owner Type
Purchase Details
Closed on
Jan 29, 1998
Sold by
Keefe Mary T and Keefe Michael P
Bought by
Dubrow Sheldon H and Dubrow Michele D
Current Estimated Value
Home Financials for this Owner
Home Financials are based on the most recent Mortgage that was taken out on this home.
Original Mortgage
$106,200
Outstanding Balance
$18,834
Interest Rate
7.02%
Mortgage Type
Purchase Money Mortgage
Estimated Equity
$1,198,569
Create a Home Valuation Report for This Property
The Home Valuation Report is an in-depth analysis detailing your home's value as well as a comparison with similar homes in the area
Home Values in the Area
Average Home Value in this Area
Purchase History
| Date | Buyer | Sale Price | Title Company |
|---|---|---|---|
| Dubrow Sheldon H | $118,000 | -- | |
| Dubrow Sheldon H | $118,000 | -- |
Source: Public Records
Mortgage History
| Date | Status | Borrower | Loan Amount |
|---|---|---|---|
| Open | Dubrow Sheldon H | $106,200 | |
| Closed | Dubrow Sheldon H | $106,200 |
Source: Public Records
Tax History Compared to Growth
Tax History
| Year | Tax Paid | Tax Assessment Tax Assessment Total Assessment is a certain percentage of the fair market value that is determined by local assessors to be the total taxable value of land and additions on the property. | Land | Improvement |
|---|---|---|---|---|
| 2025 | $4,538 | $1,048,100 | $306,200 | $741,900 |
| 2024 | $4,431 | $1,009,400 | $294,500 | $714,900 |
| 2023 | $4,321 | $925,200 | $267,700 | $657,500 |
| 2022 | $3,957 | $706,600 | $211,000 | $495,600 |
| 2021 | $0 | $640,100 | $206,900 | $433,200 |
| 2020 | $0 | $619,000 | $206,900 | $412,100 |
| 2019 | $0 | $559,100 | $220,200 | $338,900 |
| 2018 | $0 | $537,000 | $209,600 | $327,400 |
| 2017 | $0 | $520,500 | $193,100 | $327,400 |
| 2016 | $3,010 | $460,900 | $182,100 | $278,800 |
| 2015 | $2,950 | $460,900 | $182,100 | $278,800 |
| 2014 | $2,800 | $440,900 | $171,000 | $269,900 |
Source: Public Records
Map
Nearby Homes
- 1 Belmont Rd Unit 630
- 1 Belmont Rd Unit 513
- 1 E Belmont Unit 630
- 26 Manning Rd
- 11 Ocean Park W
- 3 Fairbanks Dr
- 9 Chase Ave Unit 6
- 159 Center St Unit 22
- 402 Old Wharf Rd
- 402 Old Wharf Rd
- 405 Old Wharf Rd Unit B204
- 405 Old Wharf Rd Unit B204
- 73 Division St
- 12 Cross St
- 19 Riverway
- 148 Belmont Rd
- 19 Riverway
- 102 Sea St
- 24 Chase St
- 24 Chase St