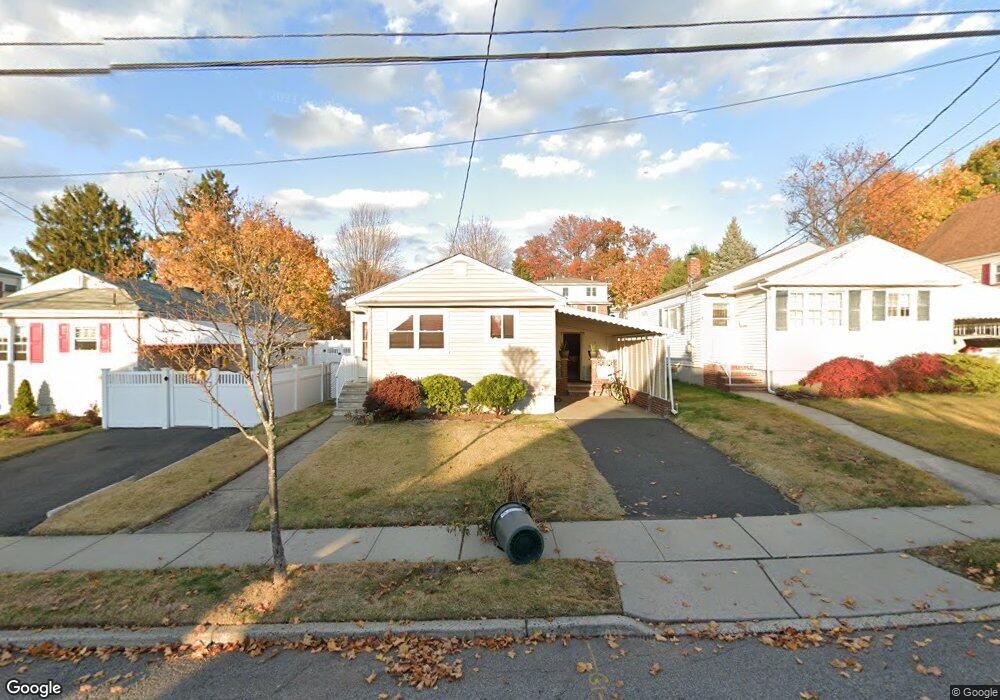
37 Carlyle Ct Carlstadt, NJ 07072
Estimated Value: $514,779 - $601,000
--
Bed
--
Bath
878
Sq Ft
$637/Sq Ft
Est. Value
About This Home
This home is located at 37 Carlyle Ct, Carlstadt, NJ 07072 and is currently estimated at $559,445, approximately $637 per square foot. 37 Carlyle Ct is a home located in Bergen County with nearby schools including Carlstadt Public School, Henry P Becton Regional High School, and Montessori School of East Rutherford.
Ownership History
Date
Name
Owned For
Owner Type
Purchase Details
Closed on
Aug 13, 2014
Sold by
Scheri Jeanette H and Scheri Jeannette
Bought by
Kang Joanne C and Kang Il Pom
Current Estimated Value
Home Financials for this Owner
Home Financials are based on the most recent Mortgage that was taken out on this home.
Original Mortgage
$225,200
Outstanding Balance
$123,415
Interest Rate
4.14%
Mortgage Type
New Conventional
Estimated Equity
$436,030
Purchase Details
Closed on
Jan 10, 2014
Sold by
Scheri Jeanette H
Bought by
Scheri Jeanette H
Create a Home Valuation Report for This Property
The Home Valuation Report is an in-depth analysis detailing your home's value as well as a comparison with similar homes in the area
Home Values in the Area
Average Home Value in this Area
Purchase History
| Date | Buyer | Sale Price | Title Company |
|---|---|---|---|
| Kang Joanne C | $281,500 | -- | |
| Scheri Jeanette H | -- | -- |
Source: Public Records
Mortgage History
| Date | Status | Borrower | Loan Amount |
|---|---|---|---|
| Open | Kang Joanne C | $225,200 |
Source: Public Records
Tax History Compared to Growth
Tax History
| Year | Tax Paid | Tax Assessment Tax Assessment Total Assessment is a certain percentage of the fair market value that is determined by local assessors to be the total taxable value of land and additions on the property. | Land | Improvement |
|---|---|---|---|---|
| 2025 | $5,860 | $368,900 | $239,600 | $129,300 |
| 2024 | $5,331 | $352,800 | $227,100 | $125,700 |
| 2023 | $5,096 | $324,100 | $212,100 | $112,000 |
| 2022 | $5,096 | $301,900 | $194,900 | $107,000 |
| 2021 | $5,169 | $285,100 | $182,400 | $102,700 |
| 2020 | $4,926 | $277,500 | $176,400 | $101,100 |
| 2019 | $4,960 | $270,300 | $172,400 | $97,900 |
| 2018 | $5,130 | $266,900 | $169,900 | $97,000 |
| 2017 | $5,009 | $262,800 | $167,400 | $95,400 |
| 2016 | $5,196 | $244,400 | $158,500 | $85,900 |
| 2015 | $5,059 | $244,400 | $158,500 | $85,900 |
| 2014 | $4,866 | $244,400 | $158,500 | $85,900 |
Source: Public Records
Map
Nearby Homes
- 592 Central Ave
- 148 12th St
- 89 Rose St
- 271 North Ave
- 507 Washington St
- 364 Wood Ridge Ave
- 147 14th St
- 30 Humboldt St
- 53 Hackensack St
- 409 Washington St
- 38 Hackensack St
- 62 Johnson Ave
- 152 Helm Ave
- 148 Hackensack St
- 327 Madison St
- 289 Bradley Dr
- 225 Marlboro Rd
- 176 Hackensack St Unit 6
- 165 Madison St
- 16 Arnold Dr Unit 5308