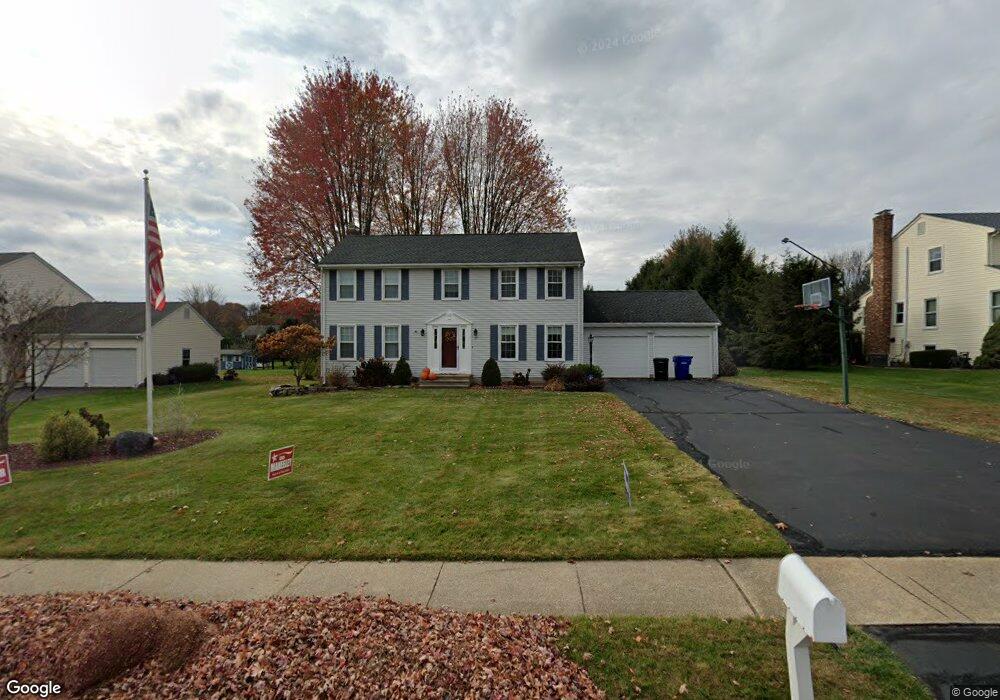
37 Carson Way South Windsor, CT 06074
Estimated Value: $554,000 - $650,000
4
Beds
3
Baths
1,920
Sq Ft
$313/Sq Ft
Est. Value
About This Home
This home is located at 37 Carson Way, South Windsor, CT 06074 and is currently estimated at $600,940, approximately $312 per square foot. 37 Carson Way is a home located in Hartford County with nearby schools including Timothy Edwards School and South Windsor High School.
Ownership History
Date
Name
Owned For
Owner Type
Purchase Details
Closed on
Aug 18, 1992
Sold by
Dart Hill Realty Inc
Bought by
Seypura Lynn
Current Estimated Value
Home Financials for this Owner
Home Financials are based on the most recent Mortgage that was taken out on this home.
Original Mortgage
$146,616
Interest Rate
8.26%
Mortgage Type
Unknown
Create a Home Valuation Report for This Property
The Home Valuation Report is an in-depth analysis detailing your home's value as well as a comparison with similar homes in the area
Home Values in the Area
Average Home Value in this Area
Purchase History
| Date | Buyer | Sale Price | Title Company |
|---|---|---|---|
| Seypura Lynn | $178,000 | -- |
Source: Public Records
Mortgage History
| Date | Status | Borrower | Loan Amount |
|---|---|---|---|
| Closed | Seypura Lynn | $115,108 | |
| Closed | Seypura Lynn | $150,000 | |
| Closed | Seypura Lynn | $60,019 | |
| Closed | Seypura Lynn | $146,616 |
Source: Public Records
Tax History
| Year | Tax Paid | Tax Assessment Tax Assessment Total Assessment is a certain percentage of the fair market value that is determined by local assessors to be the total taxable value of land and additions on the property. | Land | Improvement |
|---|---|---|---|---|
| 2025 | $10,014 | $281,200 | $113,700 | $167,500 |
| 2024 | $9,690 | $281,200 | $113,700 | $167,500 |
| 2023 | $9,319 | $281,200 | $113,700 | $167,500 |
| 2022 | $8,475 | $218,600 | $105,300 | $113,300 |
| 2021 | $8,276 | $218,600 | $105,300 | $113,300 |
| 2020 | $8,281 | $218,600 | $105,300 | $113,300 |
| 2019 | $8,416 | $218,600 | $105,300 | $113,300 |
| 2018 | $8,235 | $218,600 | $105,300 | $113,300 |
| 2017 | $8,096 | $212,600 | $105,300 | $107,300 |
| 2016 | $7,938 | $212,600 | $105,300 | $107,300 |
| 2015 | $7,768 | $212,600 | $105,300 | $107,300 |
| 2014 | $7,549 | $212,600 | $105,300 | $107,300 |
Source: Public Records
Map
Nearby Homes
- 74 Wapping Wood Rd
- 37 Vista View Ln Unit 37
- 610 Niederwerfer Rd
- 64 Garnet Ln
- 51 Carriage Dr
- 3 Brookmeadow Ln
- 33 Ash Rd
- 655 Talcottville Rd Unit 45
- 1 Abbott Rd Unit 44
- 1 Abbott Rd Unit 40
- 343 Merline Rd
- 14 Pinney St Unit 46
- 76 Griffin Rd
- 555 Graham Rd
- 11 Settlers Way
- 814 Graham Rd
- 1106 Summer Hill Dr
- 325 Kelly Rd Unit TRLR R19
- 14 Wilson Ln
- 28 Tracy Dr
Your Personal Tour Guide
Ask me questions while you tour the home.