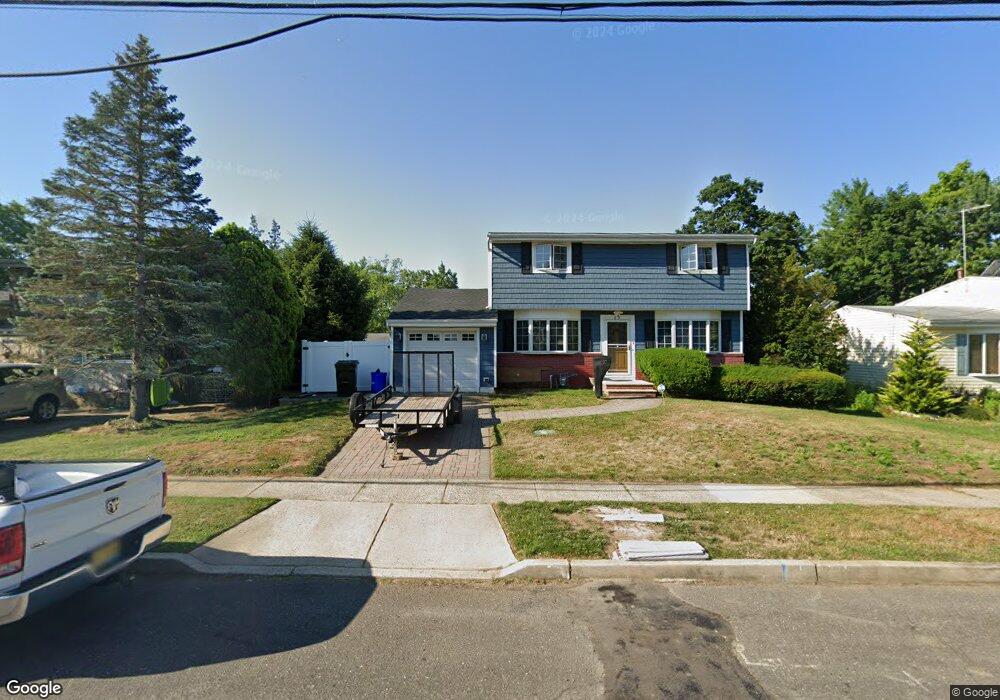
37 Cindy St Old Bridge, NJ 08857
Estimated Value: $479,217 - $652,000
Studio
--
Bath
1,380
Sq Ft
$406/Sq Ft
Est. Value
About This Home
This home is located at 37 Cindy St, Old Bridge, NJ 08857 and is currently estimated at $560,804, approximately $406 per square foot. 37 Cindy St is a home located in Middlesex County with nearby schools including Old Bridge High School, St. Ambrose School, and Calvary Christian School.
Ownership History
Date
Name
Owned For
Owner Type
Purchase Details
Closed on
Apr 23, 2024
Sold by
Barrett Thomas E and Pagkalinawan Caitlyn Elizabeth
Bought by
Barrett Thomas E
Current Estimated Value
Home Financials for this Owner
Home Financials are based on the most recent Mortgage that was taken out on this home.
Original Mortgage
$275,500
Outstanding Balance
$271,313
Interest Rate
6.79%
Mortgage Type
New Conventional
Estimated Equity
$289,491
Purchase Details
Closed on
Mar 30, 2023
Sold by
Barrett Kim M
Bought by
Barrett Thomas E and Pagkalinawan Caitlyn Elizabeth
Home Financials for this Owner
Home Financials are based on the most recent Mortgage that was taken out on this home.
Original Mortgage
$260,000
Interest Rate
6.42%
Mortgage Type
New Conventional
Purchase Details
Closed on
Jul 8, 1987
Bought by
Barrett Thomas and Barrett Kim
Create a Home Valuation Report for This Property
The Home Valuation Report is an in-depth analysis detailing your home's value as well as a comparison with similar homes in the area
Home Values in the Area
Average Home Value in this Area
Purchase History
| Date | Buyer | Sale Price | Title Company |
|---|---|---|---|
| Barrett Thomas E | -- | None Listed On Document | |
| Barrett Thomas E | -- | None Listed On Document | |
| Barrett Thomas E | $300,000 | First American Title | |
| Barrett Thomas E | $300,000 | First American Title | |
| Barrett Thomas | $158,000 | -- |
Source: Public Records
Mortgage History
| Date | Status | Borrower | Loan Amount |
|---|---|---|---|
| Open | Barrett Thomas E | $275,500 | |
| Closed | Barrett Thomas E | $275,500 | |
| Previous Owner | Barrett Thomas E | $260,000 |
Source: Public Records
Tax History
| Year | Tax Paid | Tax Assessment Tax Assessment Total Assessment is a certain percentage of the fair market value that is determined by local assessors to be the total taxable value of land and additions on the property. | Land | Improvement |
|---|---|---|---|---|
| 2025 | $8,369 | $148,200 | $69,000 | $79,200 |
| 2024 | $8,028 | $148,200 | $69,000 | $79,200 |
| 2023 | $8,028 | $148,200 | $69,000 | $79,200 |
| 2022 | $7,844 | $148,200 | $69,000 | $79,200 |
| 2021 | $7,613 | $148,200 | $69,000 | $79,200 |
| 2020 | $7,613 | $148,200 | $69,000 | $79,200 |
| 2019 | $7,484 | $148,200 | $69,000 | $79,200 |
| 2018 | $7,401 | $148,200 | $69,000 | $79,200 |
| 2017 | $7,161 | $148,200 | $69,000 | $79,200 |
| 2016 | $7,013 | $148,200 | $69,000 | $79,200 |
| 2015 | $6,891 | $148,200 | $69,000 | $79,200 |
| 2014 | $6,822 | $148,200 | $69,000 | $79,200 |
Source: Public Records
Map
Nearby Homes
Your Personal Tour Guide
Ask me questions while you tour the home.