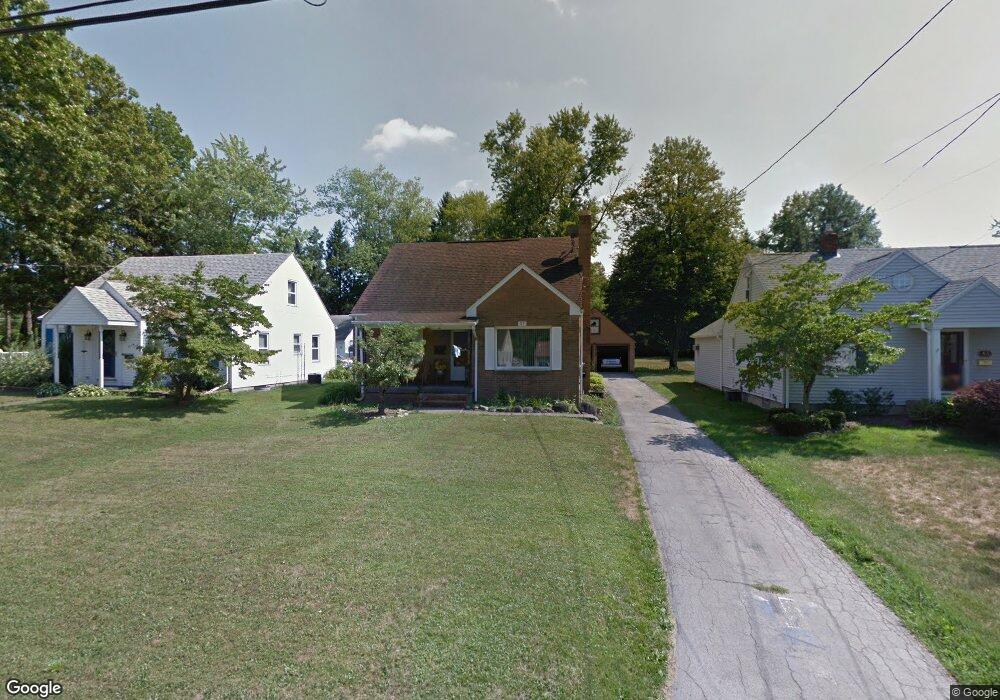
37 Clingan St Hubbard, OH 44425
Estimated Value: $166,000 - $231,000
3
Beds
2
Baths
1,434
Sq Ft
$132/Sq Ft
Est. Value
About This Home
This home is located at 37 Clingan St, Hubbard, OH 44425 and is currently estimated at $189,538, approximately $132 per square foot. 37 Clingan St is a home located in Trumbull County with nearby schools including Rahe Bulverde Elementary School, Hubbard Elementary School, and Smithson Valley Middle School.
Ownership History
Date
Name
Owned For
Owner Type
Purchase Details
Closed on
Jan 24, 2019
Sold by
Maldonado Shawn D and Maldonado Dominique C
Bought by
Crain Nelson and Crain Stephanie
Current Estimated Value
Purchase Details
Closed on
Jul 11, 2018
Sold by
Goclano Ronald R and Goclano Susan
Bought by
Maldonado Shawn D and Maldonado Dominique C
Home Financials for this Owner
Home Financials are based on the most recent Mortgage that was taken out on this home.
Original Mortgage
$84,706
Interest Rate
5.37%
Mortgage Type
FHA
Purchase Details
Closed on
Jun 25, 1996
Sold by
Studer Walter E
Bought by
Studer Michael E and Studer Doris A
Home Financials for this Owner
Home Financials are based on the most recent Mortgage that was taken out on this home.
Original Mortgage
$35,000
Interest Rate
8.29%
Mortgage Type
New Conventional
Purchase Details
Closed on
Jan 1, 1990
Bought by
Walter Studer
Create a Home Valuation Report for This Property
The Home Valuation Report is an in-depth analysis detailing your home's value as well as a comparison with similar homes in the area
Home Values in the Area
Average Home Value in this Area
Purchase History
| Date | Buyer | Sale Price | Title Company |
|---|---|---|---|
| Crain Nelson | -- | None Available | |
| Maldonado Shawn D | $92,500 | First American Mortgage Solu | |
| Studer Michael E | $35,000 | -- | |
| Walter Studer | -- | -- |
Source: Public Records
Mortgage History
| Date | Status | Borrower | Loan Amount |
|---|---|---|---|
| Previous Owner | Maldonado Shawn D | $84,706 | |
| Previous Owner | Studer Michael E | $35,000 |
Source: Public Records
Tax History Compared to Growth
Tax History
| Year | Tax Paid | Tax Assessment Tax Assessment Total Assessment is a certain percentage of the fair market value that is determined by local assessors to be the total taxable value of land and additions on the property. | Land | Improvement |
|---|---|---|---|---|
| 2024 | $2,427 | $49,640 | $4,590 | $45,050 |
| 2023 | $2,427 | $49,640 | $4,590 | $45,050 |
| 2022 | $1,576 | $29,370 | $4,100 | $25,270 |
| 2021 | $1,583 | $29,370 | $4,100 | $25,270 |
| 2020 | $1,590 | $29,370 | $4,100 | $25,270 |
| 2019 | $1,531 | $26,470 | $4,100 | $22,370 |
| 2018 | $1,526 | $26,470 | $4,100 | $22,370 |
| 2017 | $1,522 | $26,470 | $4,100 | $22,370 |
| 2016 | $1,248 | $23,030 | $4,060 | $18,970 |
| 2015 | $1,253 | $23,030 | $4,060 | $18,970 |
| 2014 | $1,225 | $23,030 | $4,060 | $18,970 |
| 2013 | $1,222 | $23,030 | $4,060 | $18,970 |
Source: Public Records
Map
Nearby Homes
- 254 Christian Ave
- 126 Stewart St
- 319 E Liberty St
- 50 Walnut St
- 110 School St
- 531 Meadowland Dr
- 114 Oakdale Ave
- 663 Meadowland Dr
- 430 E Park Ave
- 248 Myron St
- 665 Wendemere Dr
- 279 Parish Ave
- 138 Moore St
- 269 Westview Ave
- 764 Jones St
- 229 Jacobs Rd
- 395 Elizabeth St
- 611 Moore St
- 366 Westview Ave
- 462 Elizabeth St