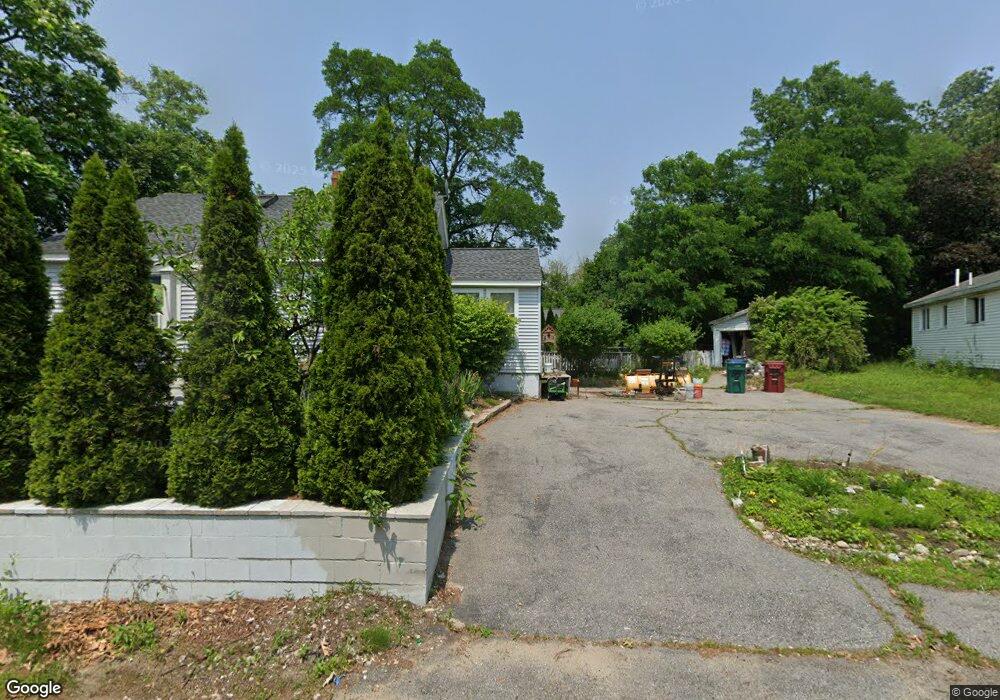
37 Columbia Rd Lowell, MA 01854
Pawtucketville NeighborhoodEstimated Value: $371,000 - $518,000
2
Beds
1
Bath
891
Sq Ft
$493/Sq Ft
Est. Value
About This Home
This home is located at 37 Columbia Rd, Lowell, MA 01854 and is currently estimated at $439,118, approximately $492 per square foot. 37 Columbia Rd is a home located in Middlesex County with nearby schools including Joseph McAvinnue Elementary School, Charlotte M. Murkland Elementary School, and Charles W. Morey Elementary School.
Ownership History
Date
Name
Owned For
Owner Type
Purchase Details
Closed on
Jul 13, 2004
Sold by
Dodge Kathleen and Gagnon Kathleen
Bought by
Koziarski Laura
Current Estimated Value
Purchase Details
Closed on
Oct 30, 2001
Sold by
Turcotte Patricia A F and Farley Patricia A
Bought by
Phung Ai and Phan Kien
Home Financials for this Owner
Home Financials are based on the most recent Mortgage that was taken out on this home.
Original Mortgage
$120,000
Interest Rate
6.86%
Mortgage Type
Purchase Money Mortgage
Purchase Details
Closed on
Jan 29, 1998
Sold by
Norwest Bank Minnesota
Bought by
Farley Patricia A
Purchase Details
Closed on
Nov 26, 1997
Sold by
Thompson Karen A
Bought by
Norwest Bk Minnesota
Purchase Details
Closed on
Dec 29, 1995
Sold by
Doyle Thomas C and Doyle Jacqueline
Bought by
Thompson Karen
Purchase Details
Closed on
Dec 5, 1991
Sold by
Kerrigan Jay M
Bought by
Doyle Thomas C and Jacqueline Doyle
Purchase Details
Closed on
Aug 6, 1990
Sold by
Doyle Raymond M
Bought by
Kerrigan Jay M
Create a Home Valuation Report for This Property
The Home Valuation Report is an in-depth analysis detailing your home's value as well as a comparison with similar homes in the area
Home Values in the Area
Average Home Value in this Area
Purchase History
| Date | Buyer | Sale Price | Title Company |
|---|---|---|---|
| Koziarski Laura | -- | -- | |
| Koziarski Laura | -- | -- | |
| Phung Ai | $150,000 | -- | |
| Phung Ai | $150,000 | -- | |
| Farley Patricia A | $89,900 | -- | |
| Farley Patricia A | $89,900 | -- | |
| Norwest Bk Minnesota | $80,000 | -- | |
| Norwest Bk Minnesota | $80,000 | -- | |
| Thompson Karen | $82,019 | -- | |
| Thompson Karen | $82,019 | -- | |
| Doyle Thomas C | $65,000 | -- | |
| Doyle Thomas C | $65,000 | -- | |
| Kerrigan Jay M | $65,000 | -- | |
| Kerrigan Jay M | $65,000 | -- |
Source: Public Records
Mortgage History
| Date | Status | Borrower | Loan Amount |
|---|---|---|---|
| Open | Kerrigan Jay M | $100,000 | |
| Previous Owner | Kerrigan Jay M | $120,000 |
Source: Public Records
Tax History
| Year | Tax Paid | Tax Assessment Tax Assessment Total Assessment is a certain percentage of the fair market value that is determined by local assessors to be the total taxable value of land and additions on the property. | Land | Improvement |
|---|---|---|---|---|
| 2025 | $4,354 | $379,300 | $185,500 | $193,800 |
| 2024 | $4,241 | $356,100 | $173,400 | $182,700 |
| 2023 | $3,961 | $318,900 | $150,800 | $168,100 |
| 2022 | $3,514 | $276,900 | $137,100 | $139,800 |
| 2021 | $3,269 | $242,900 | $119,200 | $123,700 |
| 2020 | $3,194 | $239,100 | $121,600 | $117,500 |
| 2019 | $2,861 | $203,800 | $107,100 | $96,700 |
| 2018 | $2,797 | $194,400 | $102,000 | $92,400 |
| 2017 | $2,727 | $182,800 | $92,800 | $90,000 |
| 2016 | $2,542 | $167,700 | $86,500 | $81,200 |
| 2015 | $2,475 | $159,900 | $84,700 | $75,200 |
| 2013 | $2,613 | $174,100 | $106,400 | $67,700 |
Source: Public Records
Map
Nearby Homes
- 25 W 5th Ave
- 30 4th Ave
- 89 Mammoth Rd
- 137 Crawford St
- 25 Shea St Unit 8
- 2300 Skyline Dr Unit 3
- 1400 Skyline Dr Unit 6
- 244 White St
- 79 School St Unit 3
- 28 Sarah Ave
- 15 Barbara St
- 113 School St Unit 12
- 57 Wannalancit St Unit 6
- 39 Phoebe Ave
- 548 Fletcher St
- 63 Bowers St
- 307 Pawtucket Blvd Unit 24
- 45 Hoover St
- 530 Mammoth Rd Unit 42
- 295 Pawtucket Blvd Unit 7
Your Personal Tour Guide
Ask me questions while you tour the home.