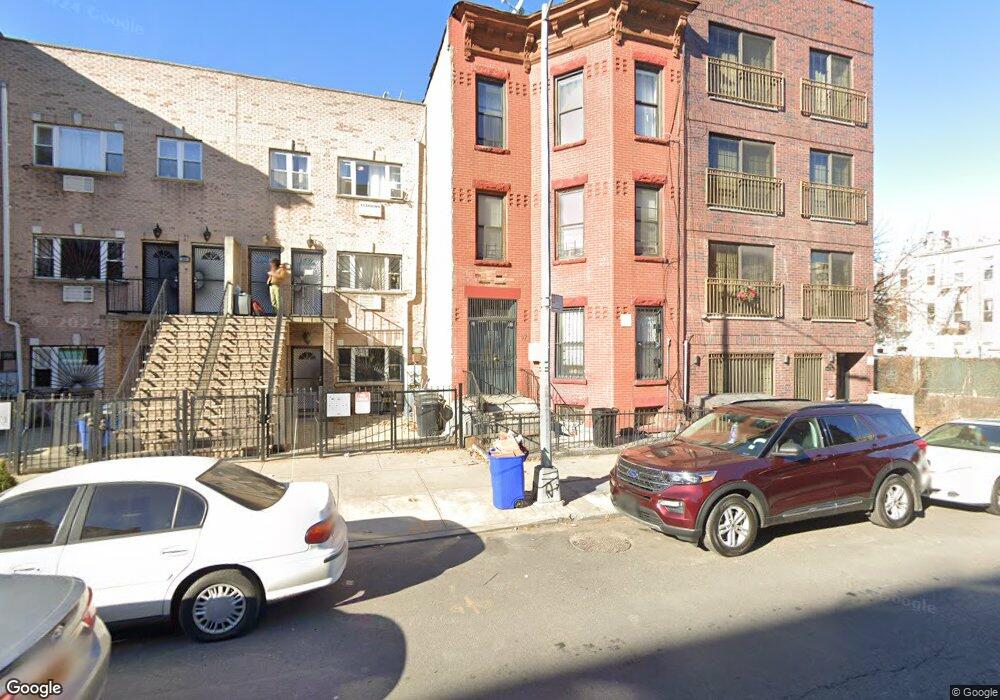
37 Cooper St Brooklyn, NY 11207
Bushwick NeighborhoodEstimated Value: $1,338,000 - $1,694,000
Studio
--
Bath
2,937
Sq Ft
$497/Sq Ft
Est. Value
About This Home
This home is located at 37 Cooper St, Brooklyn, NY 11207 and is currently estimated at $1,460,333, approximately $497 per square foot. 37 Cooper St is a home located in Kings County with nearby schools including P.S./I.S. 045 Horace E. Greene, Evergreen Middle School for Urban Exploration, and Bushwick Ascend Middle School Charter School.
Ownership History
Date
Name
Owned For
Owner Type
Purchase Details
Closed on
Feb 10, 2025
Sold by
Best Saundra and Ward-Archer Angela
Bought by
Best Alma and Best Saundra M
Current Estimated Value
Home Financials for this Owner
Home Financials are based on the most recent Mortgage that was taken out on this home.
Original Mortgage
$655,270
Outstanding Balance
$650,254
Interest Rate
6.93%
Mortgage Type
Purchase Money Mortgage
Estimated Equity
$810,079
Purchase Details
Closed on
Jun 11, 2022
Sold by
Best Alma
Bought by
Best Saundra and Ward-Archer Angela
Purchase Details
Closed on
Aug 20, 2020
Sold by
Best Alma and Best Saundra
Bought by
Best Alma
Home Financials for this Owner
Home Financials are based on the most recent Mortgage that was taken out on this home.
Original Mortgage
$1,148,400
Outstanding Balance
$1,012,161
Interest Rate
2.9%
Mortgage Type
Purchase Money Mortgage
Estimated Equity
$448,172
Purchase Details
Closed on
Dec 12, 2018
Sold by
Best Saundra and Small Pearline
Bought by
Best Alma
Purchase Details
Closed on
Nov 4, 1997
Sold by
66 Properties Corp
Bought by
Ward Angela and Best Saundra
Home Financials for this Owner
Home Financials are based on the most recent Mortgage that was taken out on this home.
Original Mortgage
$168,891
Interest Rate
7.11%
Create a Home Valuation Report for This Property
The Home Valuation Report is an in-depth analysis detailing your home's value as well as a comparison with similar homes in the area
Home Values in the Area
Average Home Value in this Area
Purchase History
| Date | Buyer | Sale Price | Title Company |
|---|---|---|---|
| Best Alma | -- | -- | |
| Best Alma | -- | -- | |
| Best Saundra | -- | -- | |
| Best Saundra | -- | -- | |
| Best Alma | -- | -- | |
| Best Alma | -- | -- | |
| Best Alma | -- | -- | |
| Best Alma | -- | -- | |
| Ward Angela | $169,000 | -- | |
| Ward Angela | $169,000 | -- |
Source: Public Records
Mortgage History
| Date | Status | Borrower | Loan Amount |
|---|---|---|---|
| Open | Best Alma | $655,270 | |
| Closed | Best Alma | $655,270 | |
| Open | Best Alma | $1,148,400 | |
| Closed | Best Alma | $1,148,400 | |
| Previous Owner | Ward Angela | $168,891 |
Source: Public Records
Tax History
| Year | Tax Paid | Tax Assessment Tax Assessment Total Assessment is a certain percentage of the fair market value that is determined by local assessors to be the total taxable value of land and additions on the property. | Land | Improvement |
|---|---|---|---|---|
| 2025 | $2,095 | $79,260 | $12,840 | $66,420 |
| 2024 | $2,095 | $93,240 | $12,840 | $80,400 |
| 2023 | $2,045 | $88,740 | $12,840 | $75,900 |
| 2022 | $2,010 | $76,980 | $12,840 | $64,140 |
| 2021 | $2,005 | $62,100 | $12,840 | $49,260 |
| 2019 | $1,818 | $72,420 | $12,840 | $59,580 |
| 2018 | $1,710 | $8,391 | $1,404 | $6,987 |
| 2017 | $1,711 | $8,391 | $1,548 | $6,843 |
| 2016 | $1,587 | $7,940 | $1,978 | $5,962 |
| 2015 | $955 | $7,491 | $2,026 | $5,465 |
| 2014 | $955 | $7,243 | $2,353 | $4,890 |
Source: Public Records
Map
Nearby Homes
- 1392 Bushwick Ave
- 1408 Bushwick Ave
- 1008 Decatur St Unit 2A
- 1370 Bushwick Ave Unit 2B
- 1411 Bushwick Ave Unit 2 C
- 1411 Bushwick Ave Unit 3 C
- 1411 Bushwick Ave Unit 5 B
- 766 Decatur St Unit 2A
- 685 Chauncey St
- 33 Pilling St
- 81 Moffat St
- 696 Chauncey St Unit 1R
- 696 Chauncey St Unit 3F
- 443 Marion St
- 12 Pilling St
- 6 Pilling St
- 87A Cooper St Unit 4-F
- 596 Bainbridge St
- 105 Moffat St
- 1474 Bushwick Ave Unit 1R
- 37 Cooper St
- 37 Cooper St
- 37 Cooper St Unit 3R
- 37 Cooper St Unit 4R
- 37 Cooper St Unit 4F
- 37 Cooper St Unit 1R
- 37 Cooper St Unit 2R
- 37 Cooper St Unit 3F
- 37 Cooper St Unit 2F
- 37 A Cooper St
- 37 A Cooper St
- 37 A Cooper St
- 37 A Cooper St
- 37 A Cooper St
- 37 A Cooper St
- 37 A Cooper St Unit 4-R
- 37 A Cooper St
- 37 A Cooper St Unit 3-F
- 37 A Cooper St Unit 1-R
- 37 A Cooper St Unit 2-R
Your Personal Tour Guide
Ask me questions while you tour the home.