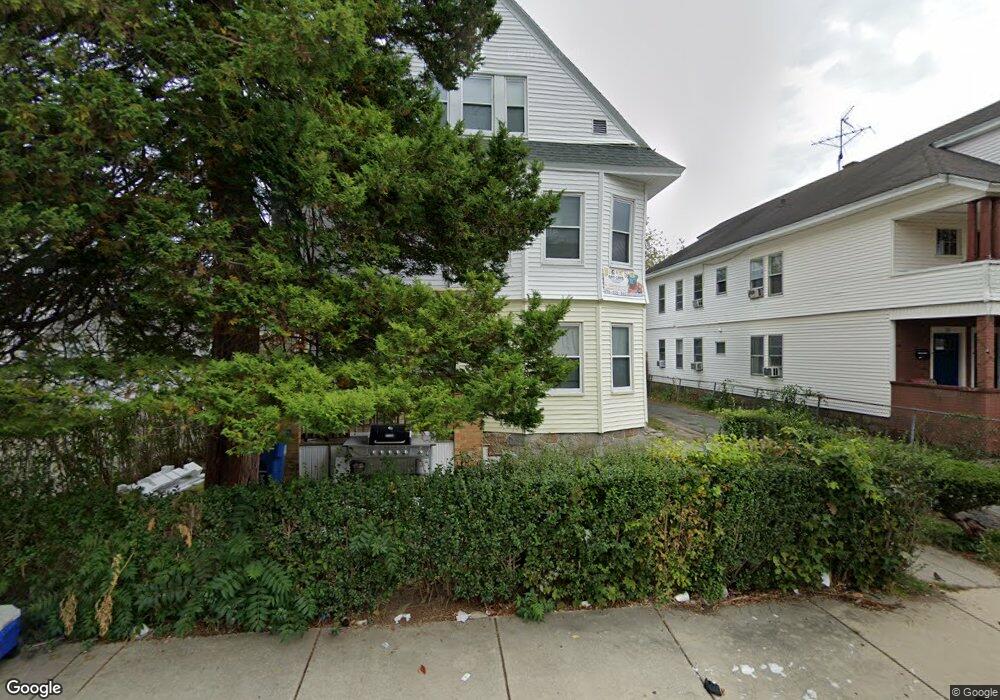
37 Cornish St Unit 39 Lawrence, MA 01841
Prospect Hill-Back Bay NeighborhoodEstimated Value: $804,070 - $922,000
6
Beds
3
Baths
3,453
Sq Ft
$249/Sq Ft
Est. Value
About This Home
This home is located at 37 Cornish St Unit 39, Lawrence, MA 01841 and is currently estimated at $860,268, approximately $249 per square foot. 37 Cornish St Unit 39 is a home located in Essex County with nearby schools including School For Exceptional Studies and Esperanza Academy School of Hope.
Ownership History
Date
Name
Owned For
Owner Type
Purchase Details
Closed on
Aug 24, 2020
Sold by
37 Cornish Rt
Bought by
Pena-Medina Styven A and Espinal Dayliana
Current Estimated Value
Home Financials for this Owner
Home Financials are based on the most recent Mortgage that was taken out on this home.
Original Mortgage
$549,857
Outstanding Balance
$486,852
Interest Rate
2.9%
Mortgage Type
FHA
Estimated Equity
$373,416
Purchase Details
Closed on
May 6, 2010
Sold by
Courtney Michael J
Bought by
37 Cornish Rt and Courtney Michael J
Purchase Details
Closed on
Aug 18, 2009
Sold by
Falzone Salvatore
Bought by
Deutsche Bank Natl T C
Purchase Details
Closed on
Jul 29, 2002
Sold by
City Street Rt and Ackley Kristine A
Bought by
Falzone Salvatore
Home Financials for this Owner
Home Financials are based on the most recent Mortgage that was taken out on this home.
Original Mortgage
$195,900
Interest Rate
6.73%
Mortgage Type
Purchase Money Mortgage
Create a Home Valuation Report for This Property
The Home Valuation Report is an in-depth analysis detailing your home's value as well as a comparison with similar homes in the area
Home Values in the Area
Average Home Value in this Area
Purchase History
| Date | Buyer | Sale Price | Title Company |
|---|---|---|---|
| Pena-Medina Styven A | $560,000 | None Available | |
| 37 Cornish Rt | -- | -- | |
| Courtney Michael J | $148,000 | -- | |
| Deutsche Bank Natl T C | $145,000 | -- | |
| Falzone Salvatore | $244,900 | -- |
Source: Public Records
Mortgage History
| Date | Status | Borrower | Loan Amount |
|---|---|---|---|
| Open | Pena-Medina Styven A | $549,857 | |
| Previous Owner | Falzone Salvatore | $171,500 | |
| Previous Owner | Falzone Salvatore | $195,900 |
Source: Public Records
Tax History
| Year | Tax Paid | Tax Assessment Tax Assessment Total Assessment is a certain percentage of the fair market value that is determined by local assessors to be the total taxable value of land and additions on the property. | Land | Improvement |
|---|---|---|---|---|
| 2025 | $6,245 | $709,700 | $137,300 | $572,400 |
| 2024 | $5,971 | $645,500 | $101,600 | $543,900 |
| 2023 | $6,117 | $602,100 | $99,000 | $503,100 |
| 2022 | $5,906 | $516,300 | $99,000 | $417,300 |
| 2021 | $5,531 | $450,800 | $99,000 | $351,800 |
| 2020 | $5,452 | $438,600 | $89,100 | $349,500 |
| 2019 | $5,067 | $370,400 | $80,100 | $290,300 |
| 2018 | $4,753 | $331,900 | $68,900 | $263,000 |
| 2017 | $4,346 | $283,300 | $68,100 | $215,200 |
| 2016 | $3,991 | $257,300 | $49,600 | $207,700 |
| 2015 | $3,674 | $243,000 | $49,600 | $193,400 |
Source: Public Records
Map
Nearby Homes
- 25-27 Bicknell Ave
- 129-131 Lexington St
- 14 Court St
- 5 Kendrick St
- 39 Swan Ave
- 12 Annette St
- 173 Jackson St
- 192 Union St
- 162 E Haverhill St
- 131A Lawrence St Unit 40
- 97 Kenwood Rd
- 7-9 Bennington St
- 65 Arthur St
- 37 Albion St
- 18 Erhardt Terrace
- 7 Erhardt Terrace
- 434-438 Hampshire St
- 106 Leroy Ave
- 109 Ferry St
- 89 Newbury St Unit 89B
- 33 Cornish St Unit 35
- 55A Swan St Unit B
- 40 Montgomery St
- 36 Montgomery St
- 61 Swan St Unit 63
- 57 Swan St Unit 59
- 65 Swan St Unit 67
- 44 Montgomery St
- 44 Montgomery St Unit 1
- 44 Cornish St Unit 46
- 40 Cornish St Unit 42
- 53 Swan St Unit 55
- 53-55 Swan St
- 55 A&B Swan St
- 36 Cornish St Unit 38
- 36-38 Cornish St
- 48 Montgomery St
- 51 Swan St Unit 51A
- 69 Swan St Unit 71
- 27-29 Cornish St
Your Personal Tour Guide
Ask me questions while you tour the home.