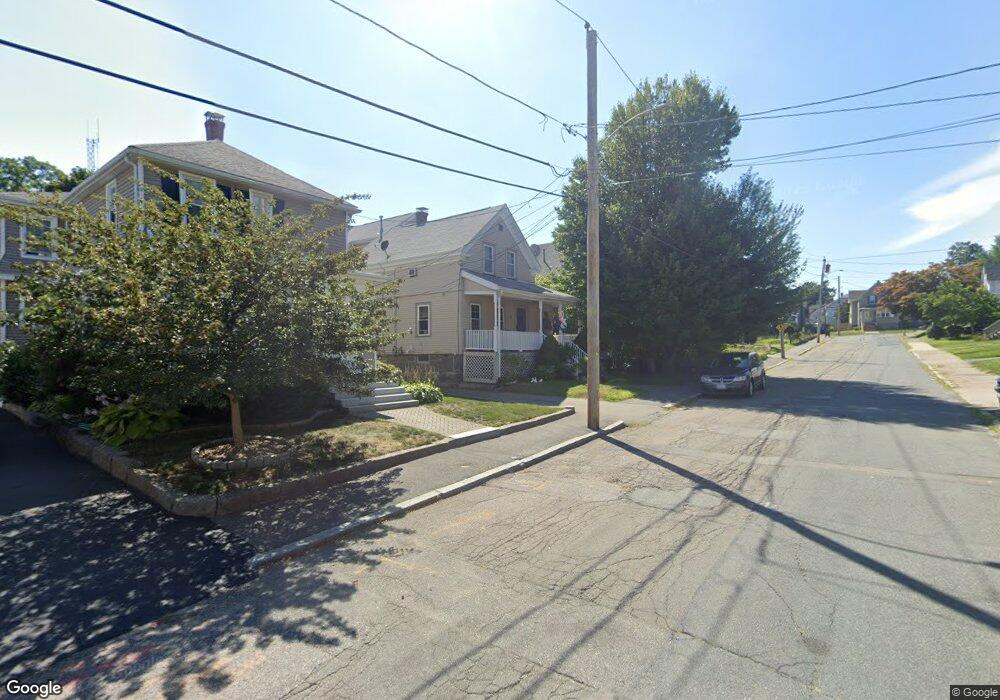
37 Cranch St Quincy, MA 02169
Quincy Center NeighborhoodEstimated Value: $899,000 - $1,118,000
5
Beds
2
Baths
2,526
Sq Ft
$387/Sq Ft
Est. Value
About This Home
This home is located at 37 Cranch St, Quincy, MA 02169 and is currently estimated at $978,731, approximately $387 per square foot. 37 Cranch St is a home located in Norfolk County with nearby schools including Charles A. Bernazzani Elementary School, Central Middle School, and Quincy High School.
Ownership History
Date
Name
Owned For
Owner Type
Purchase Details
Closed on
Sep 26, 2008
Sold by
Campbell David A and Campbell Kathryn G
Bought by
Campbell David A and Campbell Kathryn G
Current Estimated Value
Purchase Details
Closed on
Jun 11, 2007
Sold by
Fitzmaurice Mary and Fitzmaurice Shawn C
Bought by
Campbell David A and Campbell Kathryn G
Home Financials for this Owner
Home Financials are based on the most recent Mortgage that was taken out on this home.
Original Mortgage
$384,000
Interest Rate
6.17%
Mortgage Type
Purchase Money Mortgage
Create a Home Valuation Report for This Property
The Home Valuation Report is an in-depth analysis detailing your home's value as well as a comparison with similar homes in the area
Home Values in the Area
Average Home Value in this Area
Purchase History
We collect this data history from publicly available records. To have your information removed, we recommend requesting removal directly through your county’s website.
| Date | Buyer | Sale Price | Title Company |
|---|---|---|---|
| Campbell David A | -- | -- | |
| Campbell David A | $480,000 | -- |
Source: Public Records
Mortgage History
We collect this data history from publicly available records. To have your information removed, we recommend requesting removal directly through your county’s website.
| Date | Status | Borrower | Loan Amount |
|---|---|---|---|
| Previous Owner | Campbell David A | $384,000 | |
| Previous Owner | Campbell David A | $72,000 |
Source: Public Records
Tax History
| Year | Tax Paid | Tax Assessment Tax Assessment Total Assessment is a certain percentage of the fair market value that is determined by local assessors to be the total taxable value of land and additions on the property. | Land | Improvement |
|---|---|---|---|---|
| 2025 | $8,939 | $775,300 | $317,500 | $457,800 |
| 2024 | $8,375 | $743,100 | $302,900 | $440,200 |
| 2023 | $7,713 | $693,000 | $276,300 | $416,700 |
| 2022 | $8,219 | $686,100 | $252,100 | $434,000 |
| 2021 | $7,721 | $636,000 | $252,100 | $383,900 |
| 2020 | $7,426 | $597,400 | $240,500 | $356,900 |
| 2019 | $7,261 | $578,600 | $227,500 | $351,100 |
| 2018 | $7,253 | $543,700 | $227,500 | $316,200 |
| 2017 | $7,228 | $510,100 | $217,200 | $292,900 |
| 2016 | $6,876 | $478,800 | $207,300 | $271,500 |
| 2015 | $6,652 | $455,600 | $207,300 | $248,300 |
| 2014 | $6,313 | $424,800 | $197,900 | $226,900 |
Source: Public Records
Map
Nearby Homes
- 165 Whitwell St
- 154 Glendale Rd Unit 2
- 43 Dixwell Ave
- 45 Colonial Dr
- 148 Presidents Ln Unit 1
- 195 Thomas Burgin Pkwy Unit 301
- 312 Adams St
- 200 Adams St
- 91 Garfield St
- 77 Adams St Unit 611
- 77 Adams St Unit 610
- 20 Whitney Rd Unit 1
- 2 Cliveden St Unit 601E
- 2 Cliveden St Unit 405E
- 999 Hancock St Unit 502
- 44 Greenleaf St
- 1022 Hancock St Unit 112
- 10 Edgemere Rd
- 8 Jackson St Unit C4
- 8 Jackson St Unit B4
- 41 Cranch St
- 45 Cranch St
- 27 Cranch St Unit 29
- 38 Cranch St
- 33 Cranch St
- 33 Cranch St Unit 2169
- 34 Cranch St
- 42 Cranch St
- 42 Cranch St Unit 1
- 42 Cranch St
- 42 Cranch St Unit 2
- 29 1/2 Cranch St
- 51 Cranch St
- 30 Cranch St
- 46 Cranch St
- 26 Cranch St
- 23 Cranch St Unit 3
- 23 Cranch St
- 49 Cranch St
- 48 Cranch St
Your Personal Tour Guide
Ask me questions while you tour the home.