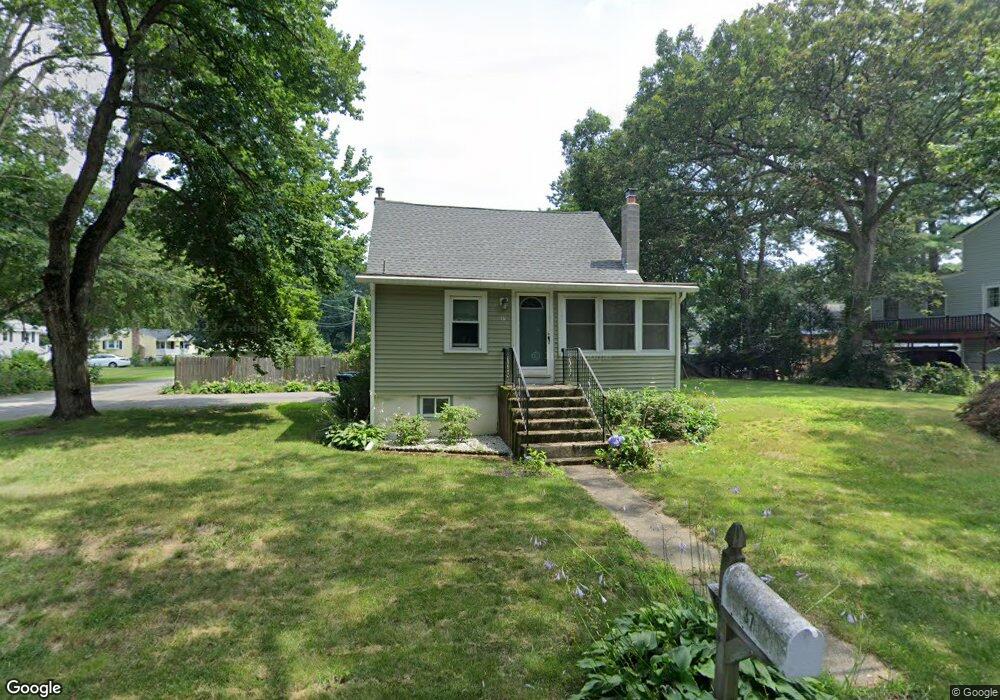
37 Crescent St Wilmington, MA 01887
Estimated Value: $595,000 - $756,000
2
Beds
1
Bath
1,440
Sq Ft
$453/Sq Ft
Est. Value
About This Home
This home is located at 37 Crescent St, Wilmington, MA 01887 and is currently estimated at $652,365, approximately $453 per square foot. 37 Crescent St is a home located in Middlesex County with nearby schools including Wilmington Middle School, Wilmington High School, and Abundant Life Christian School and Childcare.
Ownership History
Date
Name
Owned For
Owner Type
Purchase Details
Closed on
Jun 13, 2001
Sold by
Abbatiello Russell A and Abbatiello Susan E
Bought by
Duong Cam H
Current Estimated Value
Purchase Details
Closed on
Oct 30, 1998
Sold by
Godding Virginia A
Bought by
Abbatiello Russell A
Purchase Details
Closed on
Feb 28, 1991
Sold by
Martiniello Anthony and Martiniello Wendy
Bought by
Godding George R
Create a Home Valuation Report for This Property
The Home Valuation Report is an in-depth analysis detailing your home's value as well as a comparison with similar homes in the area
Home Values in the Area
Average Home Value in this Area
Purchase History
| Date | Buyer | Sale Price | Title Company |
|---|---|---|---|
| Duong Cam H | $220,000 | -- | |
| Abbatiello Russell A | $159,500 | -- | |
| Godding George R | $134,500 | -- |
Source: Public Records
Mortgage History
| Date | Status | Borrower | Loan Amount |
|---|---|---|---|
| Open | Godding George R | $160,000 | |
| Closed | Godding George R | $176,376 | |
| Closed | Godding George R | $208,100 |
Source: Public Records
Tax History Compared to Growth
Tax History
| Year | Tax Paid | Tax Assessment Tax Assessment Total Assessment is a certain percentage of the fair market value that is determined by local assessors to be the total taxable value of land and additions on the property. | Land | Improvement |
|---|---|---|---|---|
| 2025 | $6,233 | $544,400 | $299,800 | $244,600 |
| 2024 | $6,081 | $532,000 | $299,800 | $232,200 |
| 2023 | $5,799 | $485,700 | $272,500 | $213,200 |
| 2022 | $5,707 | $438,000 | $227,000 | $211,000 |
| 2021 | $5,436 | $392,800 | $206,400 | $186,400 |
| 2020 | $5,329 | $392,400 | $206,400 | $186,000 |
| 2019 | $5,110 | $371,600 | $196,600 | $175,000 |
| 2018 | $4,922 | $341,600 | $187,200 | $154,400 |
| 2017 | $4,461 | $308,700 | $178,300 | $130,400 |
| 2016 | $4,313 | $294,800 | $169,800 | $125,000 |
| 2015 | $4,068 | $283,100 | $169,800 | $113,300 |
| 2014 | $3,754 | $263,600 | $161,700 | $101,900 |
Source: Public Records
Map
Nearby Homes