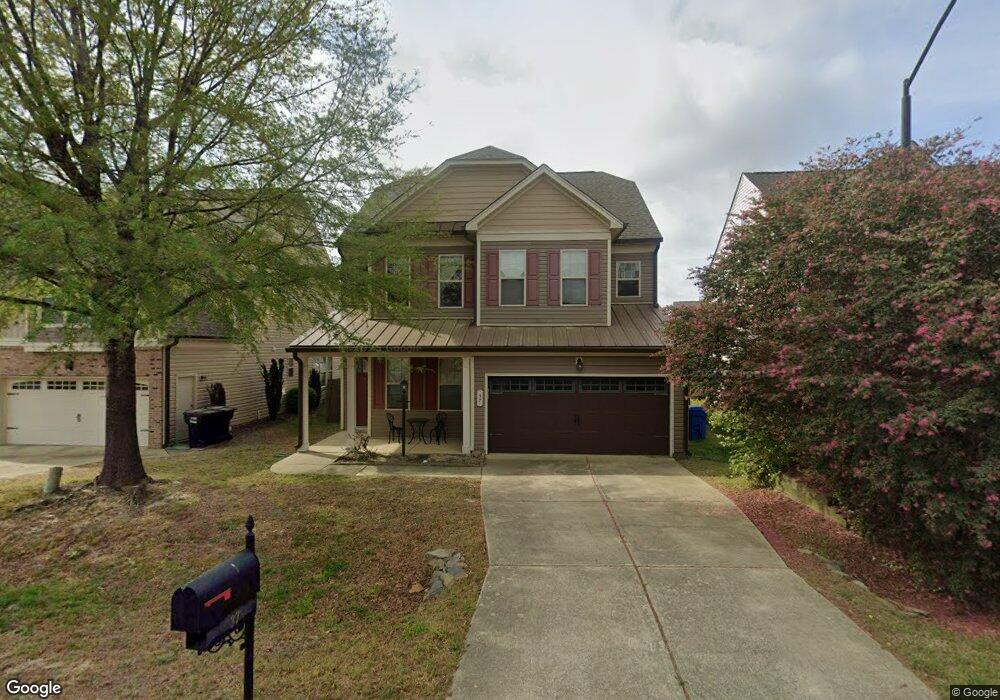
37 Crest Cir Unit 29 Garner, NC 27529
Estimated Value: $440,000 - $462,000
4
Beds
3
Baths
2,585
Sq Ft
$173/Sq Ft
Est. Value
About This Home
This home is located at 37 Crest Cir Unit 29, Garner, NC 27529 and is currently estimated at $447,238, approximately $173 per square foot. 37 Crest Cir Unit 29 is a home located in Johnston County with nearby schools including West View Elementary School, Cleveland Middle School, and Cleveland High School.
Ownership History
Date
Name
Owned For
Owner Type
Purchase Details
Closed on
Sep 9, 2019
Sold by
Hunt Robert and Hunt Brenda
Bought by
Reese Jennifer Sue
Current Estimated Value
Home Financials for this Owner
Home Financials are based on the most recent Mortgage that was taken out on this home.
Original Mortgage
$234,825
Outstanding Balance
$206,109
Interest Rate
3.7%
Mortgage Type
New Conventional
Estimated Equity
$241,129
Purchase Details
Closed on
Oct 27, 2008
Sold by
Terramor Homes Inc
Bought by
Hunt Robert and Hunt Brenda
Home Financials for this Owner
Home Financials are based on the most recent Mortgage that was taken out on this home.
Original Mortgage
$223,850
Interest Rate
6.11%
Mortgage Type
FHA
Purchase Details
Closed on
Mar 27, 2008
Sold by
Rex Development Llc
Bought by
Terramor Homes Inc
Purchase Details
Closed on
Oct 30, 2007
Sold by
Cleveland Springs Llc
Bought by
Rex Development Llc
Create a Home Valuation Report for This Property
The Home Valuation Report is an in-depth analysis detailing your home's value as well as a comparison with similar homes in the area
Home Values in the Area
Average Home Value in this Area
Purchase History
| Date | Buyer | Sale Price | Title Company |
|---|---|---|---|
| Reese Jennifer Sue | $275,000 | None Available | |
| Hunt Robert | $230,000 | None Available | |
| Terramor Homes Inc | $325,500 | None Available | |
| Rex Development Llc | -- | None Available |
Source: Public Records
Mortgage History
| Date | Status | Borrower | Loan Amount |
|---|---|---|---|
| Open | Reese Jennifer Sue | $234,825 | |
| Previous Owner | Hunt Robert | $223,850 |
Source: Public Records
Tax History
| Year | Tax Paid | Tax Assessment Tax Assessment Total Assessment is a certain percentage of the fair market value that is determined by local assessors to be the total taxable value of land and additions on the property. | Land | Improvement |
|---|---|---|---|---|
| 2025 | $2,920 | $459,860 | $70,000 | $389,860 |
| 2024 | $2,380 | $293,830 | $45,000 | $248,830 |
| 2023 | $2,299 | $293,830 | $45,000 | $248,830 |
| 2022 | $2,417 | $293,830 | $45,000 | $248,830 |
| 2021 | $2,417 | $293,830 | $45,000 | $248,830 |
| 2020 | $2,446 | $293,830 | $45,000 | $248,830 |
| 2019 | $2,446 | $293,830 | $45,000 | $248,830 |
| 2018 | $2,132 | $250,070 | $28,000 | $222,070 |
| 2017 | $1,824 | $213,900 | $28,000 | $185,900 |
| 2016 | $1,824 | $213,900 | $28,000 | $185,900 |
| 2015 | $1,824 | $213,900 | $28,000 | $185,900 |
| 2014 | $1,824 | $213,900 | $28,000 | $185,900 |
Source: Public Records
Map
Nearby Homes
- 15 Crest Cir
- 188 Outwater Ridge Dr
- 66 Bannerview Dr Unit 22
- 198 Outwater Ridge Dr
- 21 Cedar Hollow Dr
- 245 Marsh Creek Dr
- 304 Marsh Creek Dr
- 433 Summerwind Plantation Dr
- 11 Forest Meadow Ct
- 60 Pepper Ln
- 94 Shady Creek Trail
- 41 Solstice Ln
- 8 Solstice Ln
- 313 Belve Dr
- 74 Tympani Ln
- 53 Hidden Grove Ct
- 35 Mountain View Dr
- 242 Thornwhistle Place
- 7301 Cleveland School Rd
- 562 Pierce Rd
- 37 Crest Cir
- 27 Crest Cir
- 27 Crest Cir Unit lot28
- 47 Crest Cir
- 47 Crest Cir Unit 30
- 55 Crest Cir
- 55 Crest Cir
- 55 Crest Cir Unit 31
- 15 Crest Cir Unit lot27
- 50 Reunion Ct
- 90 Reunion Ct
- 40 Reunion Ct
- 100 Reunion Ct
- 30 Reunion Ct
- 60 Reunion Ct
- 110 Reunion Ct
- 20 Reunion Ct
- 65 Crest Cir
- 65 Crest Cir Unit 32
- 36 Crest Cir
Your Personal Tour Guide
Ask me questions while you tour the home.