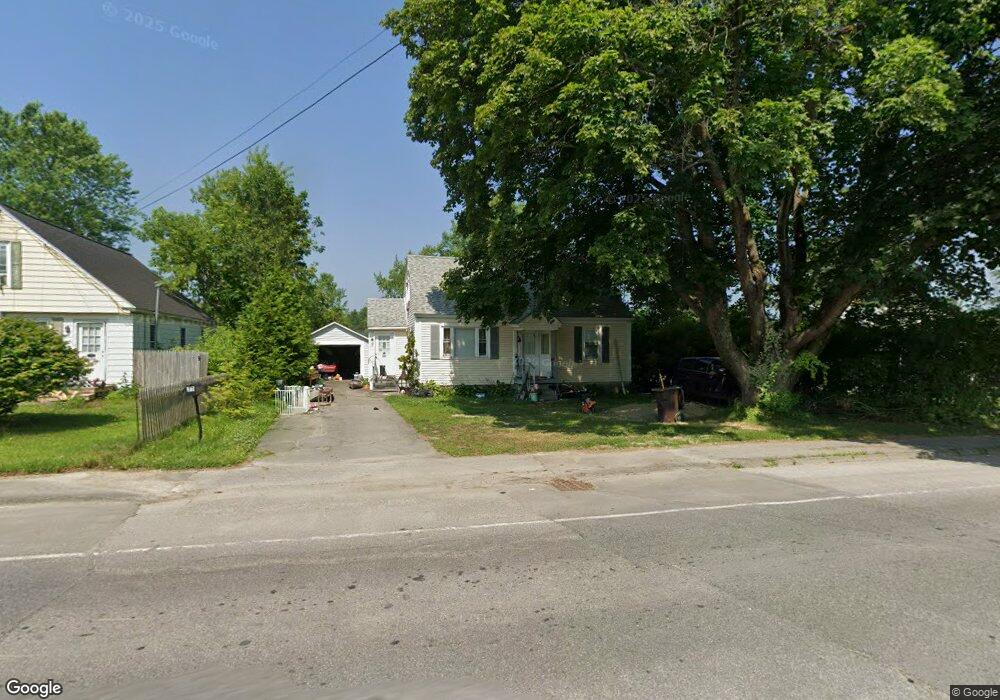
37 Cushman Rd Winslow, ME 04901
Estimated Value: $243,807 - $272,000
4
Beds
1
Bath
1,248
Sq Ft
$203/Sq Ft
Est. Value
About This Home
This home is located at 37 Cushman Rd, Winslow, ME 04901 and is currently estimated at $252,952, approximately $202 per square foot. 37 Cushman Rd is a home located in Kennebec County with nearby schools including Winslow Elementary School, Winslow Junior High School, and Winslow High School.
Ownership History
Date
Name
Owned For
Owner Type
Purchase Details
Closed on
Apr 10, 2020
Sold by
Craig Amy L
Bought by
Levesque John R
Current Estimated Value
Home Financials for this Owner
Home Financials are based on the most recent Mortgage that was taken out on this home.
Original Mortgage
$115,350
Outstanding Balance
$102,186
Interest Rate
3.4%
Mortgage Type
New Conventional
Estimated Equity
$150,766
Purchase Details
Closed on
Jul 2, 2009
Sold by
Craig Jo L
Bought by
Craig Amy L
Create a Home Valuation Report for This Property
The Home Valuation Report is an in-depth analysis detailing your home's value as well as a comparison with similar homes in the area
Home Values in the Area
Average Home Value in this Area
Purchase History
| Date | Buyer | Sale Price | Title Company |
|---|---|---|---|
| Levesque John R | -- | None Available | |
| Craig Amy L | -- | -- |
Source: Public Records
Mortgage History
| Date | Status | Borrower | Loan Amount |
|---|---|---|---|
| Open | Levesque John R | $115,350 |
Source: Public Records
Tax History Compared to Growth
Tax History
| Year | Tax Paid | Tax Assessment Tax Assessment Total Assessment is a certain percentage of the fair market value that is determined by local assessors to be the total taxable value of land and additions on the property. | Land | Improvement |
|---|---|---|---|---|
| 2024 | $2,945 | $196,300 | $27,000 | $169,300 |
| 2023 | $2,945 | $196,300 | $27,000 | $169,300 |
| 2022 | $1,664 | $102,800 | $18,400 | $84,400 |
| 2021 | $2,066 | $102,300 | $18,400 | $83,900 |
| 2020 | $1,925 | $102,300 | $18,400 | $83,900 |
| 2019 | $1,907 | $102,300 | $18,400 | $83,900 |
| 2018 | $1,835 | $102,300 | $18,400 | $83,900 |
| 2017 | $1,713 | $102,300 | $18,400 | $83,900 |
| 2016 | $1,610 | $102,300 | $18,400 | $83,900 |
| 2015 | $1,586 | $102,300 | $18,400 | $83,900 |
| 2014 | $1,586 | $102,300 | $18,400 | $83,900 |
Source: Public Records
Map
Nearby Homes