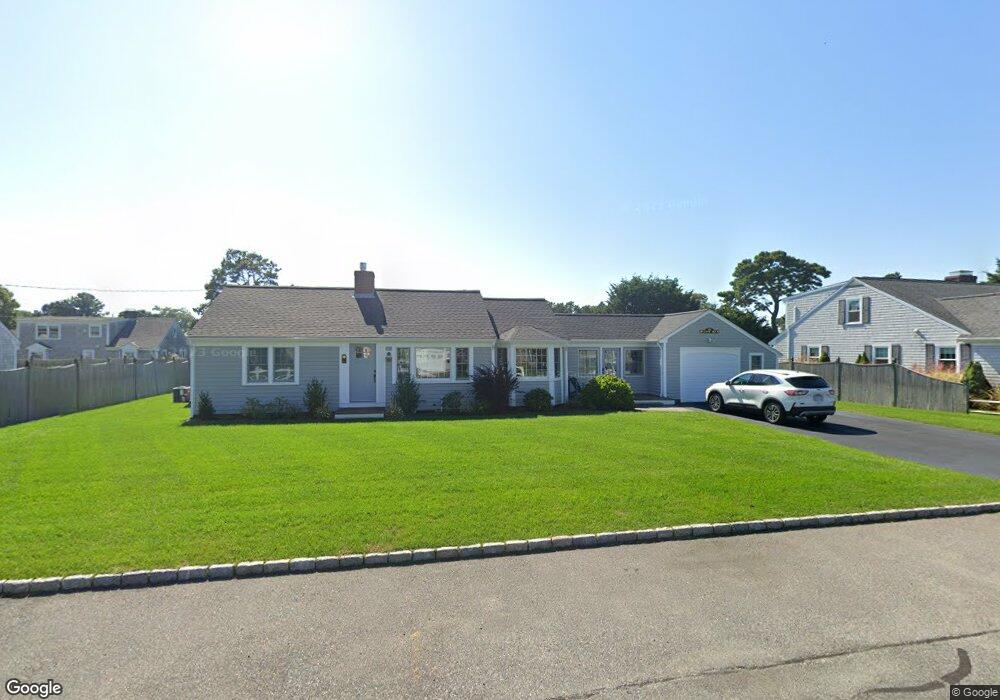
37 Davenport Rd West Dennis, MA 02670
West Dennis NeighborhoodEstimated Value: $1,001,000 - $1,332,000
2
Beds
3
Baths
1,137
Sq Ft
$965/Sq Ft
Est. Value
About This Home
This home is located at 37 Davenport Rd, West Dennis, MA 02670 and is currently estimated at $1,096,921, approximately $964 per square foot. 37 Davenport Rd is a home located in Barnstable County with nearby schools including Dennis-Yarmouth Regional High School and St. Pius X. School.
Ownership History
Date
Name
Owned For
Owner Type
Purchase Details
Closed on
Jan 5, 1996
Sold by
Fagan Richard J and Fagan Ruth M
Bought by
Lyons Martin C and Lyons Kim A
Current Estimated Value
Home Financials for this Owner
Home Financials are based on the most recent Mortgage that was taken out on this home.
Original Mortgage
$128,000
Interest Rate
7.34%
Mortgage Type
Purchase Money Mortgage
Create a Home Valuation Report for This Property
The Home Valuation Report is an in-depth analysis detailing your home's value as well as a comparison with similar homes in the area
Home Values in the Area
Average Home Value in this Area
Purchase History
| Date | Buyer | Sale Price | Title Company |
|---|---|---|---|
| Lyons Martin C | $160,000 | -- |
Source: Public Records
Mortgage History
| Date | Status | Borrower | Loan Amount |
|---|---|---|---|
| Open | Lyons Martin C | $117,000 | |
| Closed | Lyons Martin C | $128,000 |
Source: Public Records
Tax History Compared to Growth
Tax History
| Year | Tax Paid | Tax Assessment Tax Assessment Total Assessment is a certain percentage of the fair market value that is determined by local assessors to be the total taxable value of land and additions on the property. | Land | Improvement |
|---|---|---|---|---|
| 2025 | $4,553 | $1,051,500 | $540,200 | $511,300 |
| 2024 | $4,372 | $996,000 | $519,600 | $476,400 |
| 2023 | $4,180 | $895,000 | $472,300 | $422,700 |
| 2022 | $3,885 | $693,700 | $382,900 | $310,800 |
| 2021 | $3,806 | $656,900 | $375,400 | $281,500 |
| 2020 | $3,701 | $606,800 | $357,500 | $249,300 |
| 2019 | $3,550 | $575,400 | $350,500 | $224,900 |
| 2018 | $3,331 | $535,700 | $333,700 | $202,000 |
| 2017 | $3,256 | $529,400 | $333,700 | $195,700 |
| 2016 | $3,341 | $511,700 | $350,400 | $161,300 |
| 2015 | $3,272 | $511,300 | $350,400 | $160,900 |
| 2014 | $3,070 | $483,500 | $322,600 | $160,900 |
Source: Public Records
Map
Nearby Homes
- 2 Rita Mary Way
- 181 Pleasant St
- 308 Old Main St
- 14 Schoolhouse Ln
- 209 Main St Unit 3
- 209 Main St Unit 6
- 209 Main St Unit 1
- 209 Main St Unit 2
- 209 Main St Unit 4
- 209 Main St Unit 5
- 45 Seth Ln
- 40 Kelley Rd
- 745 Willow St
- 178 School St
- 23 Doric Ave
- 22 Powhatan Rd
- 29 Bass River Rd
- 17 South St
- 15 Sharon Rd
- 18 Turner Ln
- 43 Davenport Rd
- 33 Davenport Rd
- 36 Garfield Ln
- 32 Garfield Ln
- 38 Davenport Rd
- 42 Garfield Ln
- 42 Davenport Rd
- 32 Davenport Rd
- 47 Davenport Rd
- 27 Davenport Rd
- 28 Garfield Ln
- 48 Davenport Rd
- 48 Garfield Ln
- 33 Garfield Ln
- 28 Davenport Rd
- 37 Old Field Rd
- 29 Garfield Ln
- 156 Uncle Barneys Rd
- 37 Garfield Ln
- 23 Davenport Rd