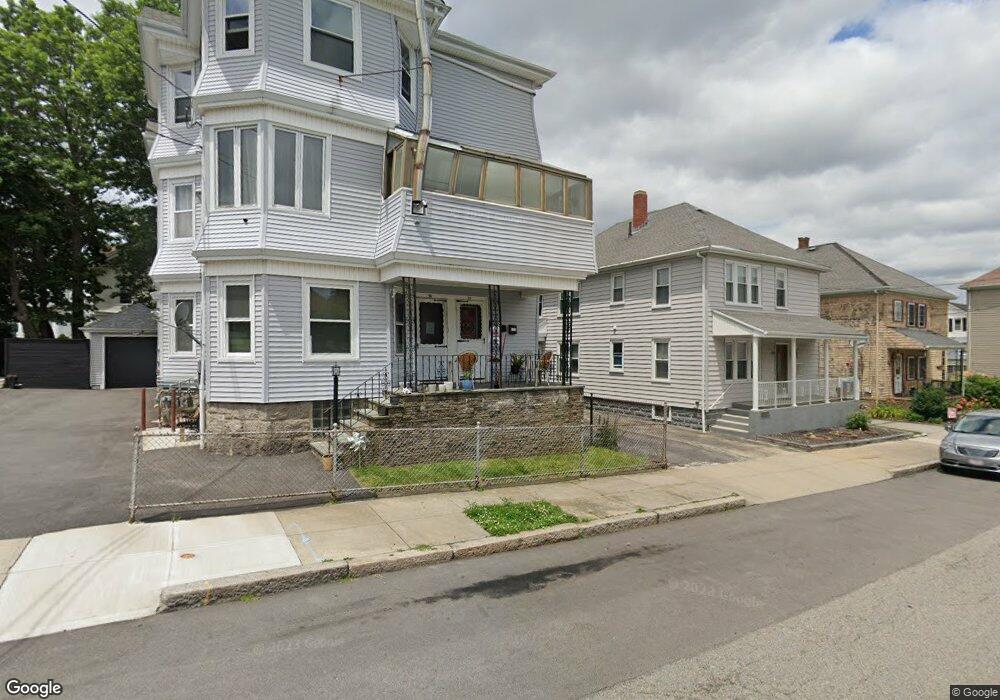
37 Day St Unit 3 Fall River, MA 02724
Father Kelly NeighborhoodEstimated Value: $568,251 - $779,000
1
Bed
4
Baths
550
Sq Ft
$1,268/Sq Ft
Est. Value
About This Home
This home is located at 37 Day St Unit 3, Fall River, MA 02724 and is currently estimated at $697,563, approximately $1,268 per square foot. 37 Day St Unit 3 is a home located in Bristol County with nearby schools including Carlton M. Viveiros Elementary School, Matthew J. Kuss Middle School, and B M C Durfee High School.
Ownership History
Date
Name
Owned For
Owner Type
Purchase Details
Closed on
Aug 23, 2017
Sold by
Reis Frances and Brooks Lori A
Bought by
Brooks Ryan
Current Estimated Value
Purchase Details
Closed on
Apr 22, 2013
Sold by
Quigley Derek and Quigley Lori
Bought by
Quigley Lori
Home Financials for this Owner
Home Financials are based on the most recent Mortgage that was taken out on this home.
Original Mortgage
$215,387
Interest Rate
3.37%
Mortgage Type
FHA
Purchase Details
Closed on
Apr 17, 2009
Sold by
Berube Joyce Adebe
Bought by
Quigley Derek and Quigley Lori
Home Financials for this Owner
Home Financials are based on the most recent Mortgage that was taken out on this home.
Original Mortgage
$227,411
Interest Rate
5.02%
Mortgage Type
FHA
Purchase Details
Closed on
Dec 29, 2006
Sold by
Berube Armand J
Bought by
Berube Joyce Adebe
Create a Home Valuation Report for This Property
The Home Valuation Report is an in-depth analysis detailing your home's value as well as a comparison with similar homes in the area
Home Values in the Area
Average Home Value in this Area
Purchase History
| Date | Buyer | Sale Price | Title Company |
|---|---|---|---|
| Brooks Ryan | -- | -- | |
| Quigley Lori | -- | -- | |
| Quigley Derek | $271,000 | -- | |
| Berube Joyce Adebe | -- | -- |
Source: Public Records
Mortgage History
| Date | Status | Borrower | Loan Amount |
|---|---|---|---|
| Previous Owner | Quigley Lori | $215,387 | |
| Previous Owner | Quigley Derek | $227,411 |
Source: Public Records
Tax History
| Year | Tax Paid | Tax Assessment Tax Assessment Total Assessment is a certain percentage of the fair market value that is determined by local assessors to be the total taxable value of land and additions on the property. | Land | Improvement |
|---|---|---|---|---|
| 2025 | $6,799 | $593,800 | $108,000 | $485,800 |
| 2024 | $6,508 | $566,400 | $104,000 | $462,400 |
| 2023 | $5,806 | $473,200 | $85,900 | $387,300 |
| 2022 | $5,173 | $409,900 | $81,800 | $328,100 |
| 2021 | $4,929 | $356,400 | $82,000 | $274,400 |
| 2020 | $4,433 | $306,800 | $80,800 | $226,000 |
| 2019 | $3,797 | $260,400 | $77,800 | $182,600 |
| 2018 | $3,658 | $250,200 | $84,300 | $165,900 |
| 2017 | $3,447 | $246,200 | $80,300 | $165,900 |
| 2016 | $3,375 | $247,600 | $85,500 | $162,100 |
| 2015 | $3,070 | $234,700 | $85,500 | $149,200 |
| 2014 | $3,081 | $244,900 | $83,000 | $161,900 |
Source: Public Records
Map
Nearby Homes
- 93 Osborn St
- 70 Brown St
- 420 Bradford Ave
- 303 Eagle St Unit C
- 221 Beach St
- 334 Fountain St
- 403 Division St Unit 13
- 403 Division St Unit 5
- 403 Division St Unit 9
- 403 Division St Unit 11
- 403 Division St Unit 12
- 403 Division St Unit 1
- 403 Division St Unit 18
- 1273-1279 S Main St
- 158 Forest St
- 71 Mystic St Unit 3
- 150 Forest St
- 82 Montaup St
- 111 Park St
- 105 Park St
Your Personal Tour Guide
Ask me questions while you tour the home.