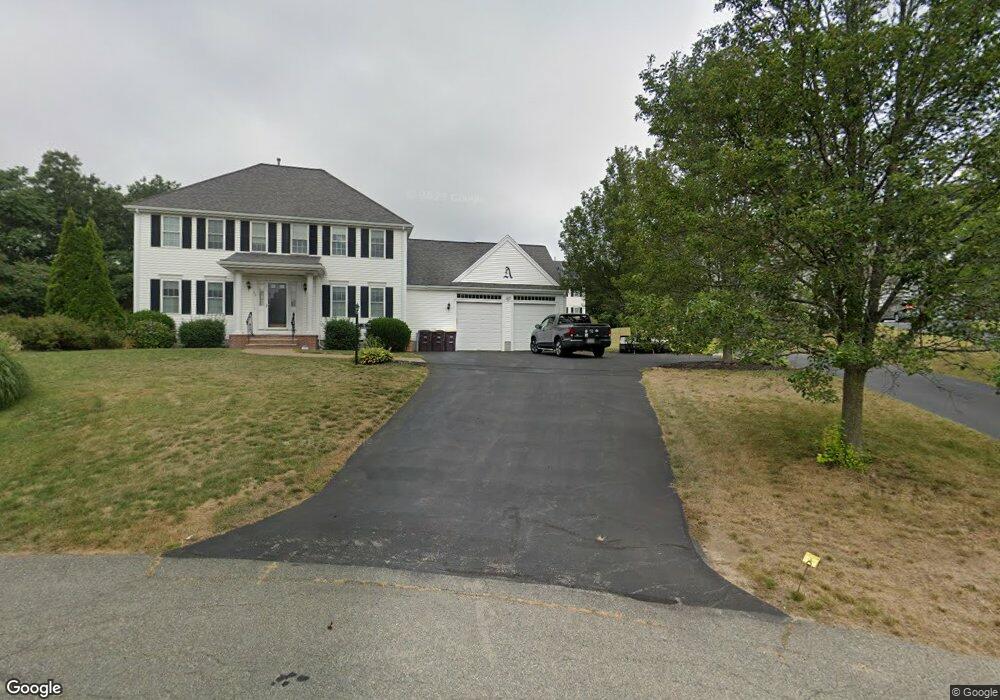
37 Df Haviland Ln Weymouth, MA 02188
Weymouth Landing NeighborhoodEstimated Value: $687,000 - $895,000
4
Beds
3
Baths
1,912
Sq Ft
$430/Sq Ft
Est. Value
About This Home
This home is located at 37 Df Haviland Ln, Weymouth, MA 02188 and is currently estimated at $823,069, approximately $430 per square foot. 37 Df Haviland Ln is a home located in Norfolk County with nearby schools including Frederick C Murphy, Abigail Adams Middle School, and Weymouth Middle School Chapman.
Ownership History
Date
Name
Owned For
Owner Type
Purchase Details
Closed on
May 4, 2005
Sold by
Batukhan Llc
Bought by
Drews Jon J
Current Estimated Value
Home Financials for this Owner
Home Financials are based on the most recent Mortgage that was taken out on this home.
Original Mortgage
$350,500
Outstanding Balance
$184,745
Interest Rate
6.01%
Mortgage Type
Purchase Money Mortgage
Estimated Equity
$638,324
Create a Home Valuation Report for This Property
The Home Valuation Report is an in-depth analysis detailing your home's value as well as a comparison with similar homes in the area
Home Values in the Area
Average Home Value in this Area
Purchase History
| Date | Buyer | Sale Price | Title Company |
|---|---|---|---|
| Drews Jon J | $549,900 | -- |
Source: Public Records
Mortgage History
| Date | Status | Borrower | Loan Amount |
|---|---|---|---|
| Open | Drews Jon J | $350,500 |
Source: Public Records
Tax History Compared to Growth
Tax History
| Year | Tax Paid | Tax Assessment Tax Assessment Total Assessment is a certain percentage of the fair market value that is determined by local assessors to be the total taxable value of land and additions on the property. | Land | Improvement |
|---|---|---|---|---|
| 2025 | $8,965 | $887,600 | $274,600 | $613,000 |
| 2024 | $8,759 | $852,900 | $261,600 | $591,300 |
| 2023 | $8,099 | $775,000 | $242,200 | $532,800 |
| 2022 | $7,906 | $689,900 | $224,300 | $465,600 |
| 2021 | $7,296 | $621,500 | $224,300 | $397,200 |
| 2020 | $6,992 | $586,600 | $224,300 | $362,300 |
| 2019 | $6,868 | $566,700 | $215,700 | $351,000 |
| 2018 | $6,789 | $543,100 | $213,900 | $329,200 |
| 2017 | $6,670 | $520,700 | $203,800 | $316,900 |
| 2016 | $6,625 | $517,600 | $195,900 | $321,700 |
| 2015 | $6,349 | $492,200 | $195,900 | $296,300 |
| 2014 | $6,121 | $460,200 | $182,300 | $277,900 |
Source: Public Records
Map
Nearby Homes
- 19 Vine St Unit 3
- 19 Vine St Unit 1
- 114 Broad St Unit D
- 114 Broad St Unit C
- 23-25 Lindbergh Ave
- 16 Lindbergh Ave
- 33 Congress St
- 76 Kingman St
- 11 Richmond St
- 286 Broad St
- 122 Washington St Unit 22
- 12 Klasson Ln
- 15 Summer St
- 24 Blake Rd
- 54 Federal St
- 286 Essex St
- 367 Essex St
- 36 Brookside Rd
- 48 Apple Tree Ln
- 42 Sundin Rd