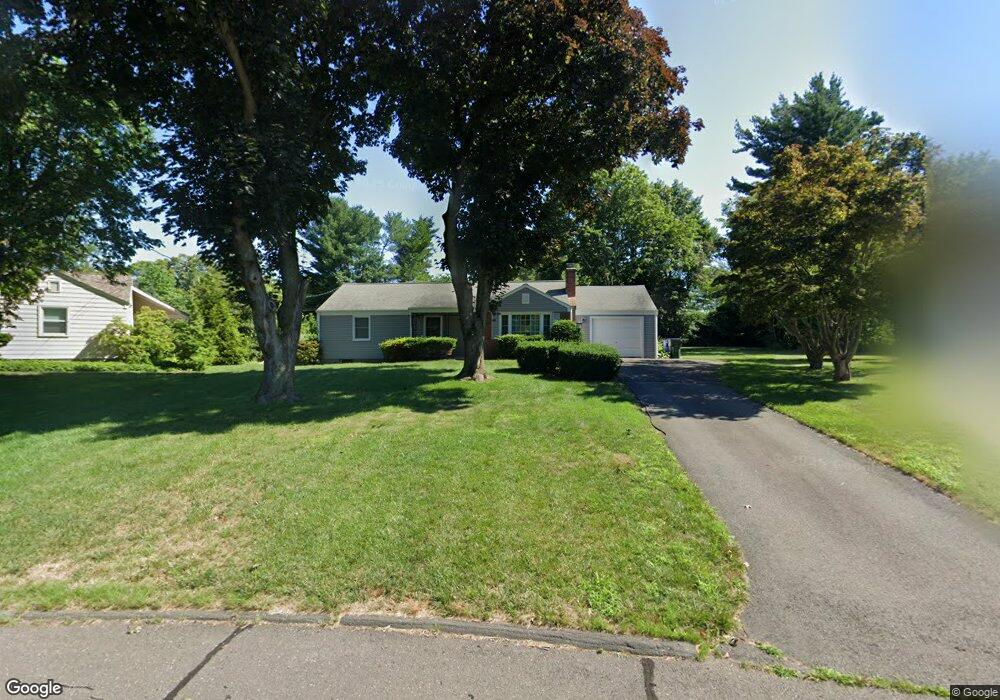
37 Dorlen Cir Wethersfield, CT 06109
Estimated Value: $391,000 - $432,680
3
Beds
3
Baths
1,226
Sq Ft
$332/Sq Ft
Est. Value
About This Home
This home is located at 37 Dorlen Cir, Wethersfield, CT 06109 and is currently estimated at $406,920, approximately $331 per square foot. 37 Dorlen Cir is a home located in Hartford County with nearby schools including Highcrest School, Silas Deane Middle School, and Wethersfield High School.
Ownership History
Date
Name
Owned For
Owner Type
Purchase Details
Closed on
Dec 1, 2016
Sold by
Neun John A and Neun Raymond M
Bought by
Angelillo Daniel M
Current Estimated Value
Home Financials for this Owner
Home Financials are based on the most recent Mortgage that was taken out on this home.
Original Mortgage
$145,600
Outstanding Balance
$117,569
Interest Rate
3.52%
Mortgage Type
Purchase Money Mortgage
Estimated Equity
$289,351
Purchase Details
Closed on
Mar 10, 2014
Sold by
Neun Frances D
Bought by
Neun Raymond M and Neun John A
Create a Home Valuation Report for This Property
The Home Valuation Report is an in-depth analysis detailing your home's value as well as a comparison with similar homes in the area
Home Values in the Area
Average Home Value in this Area
Purchase History
| Date | Buyer | Sale Price | Title Company |
|---|---|---|---|
| Angelillo Daniel M | $182,000 | -- | |
| Neun Raymond M | -- | -- |
Source: Public Records
Mortgage History
| Date | Status | Borrower | Loan Amount |
|---|---|---|---|
| Open | Neun Raymond M | $145,600 |
Source: Public Records
Tax History
| Year | Tax Paid | Tax Assessment Tax Assessment Total Assessment is a certain percentage of the fair market value that is determined by local assessors to be the total taxable value of land and additions on the property. | Land | Improvement |
|---|---|---|---|---|
| 2025 | $9,811 | $238,010 | $94,370 | $143,640 |
| 2024 | $6,846 | $158,390 | $75,680 | $82,710 |
| 2023 | $6,628 | $158,630 | $75,680 | $82,950 |
| 2022 | $6,517 | $158,630 | $75,680 | $82,950 |
| 2021 | $6,451 | $158,630 | $75,680 | $82,950 |
| 2020 | $6,455 | $158,630 | $75,680 | $82,950 |
| 2019 | $6,421 | $157,620 | $75,680 | $81,940 |
| 2018 | $6,774 | $166,100 | $76,500 | $89,600 |
| 2017 | $6,578 | $165,400 | $76,500 | $88,900 |
| 2016 | $6,375 | $165,400 | $76,500 | $88,900 |
| 2015 | $6,317 | $165,400 | $76,500 | $88,900 |
| 2014 | $6,077 | $165,400 | $76,500 | $88,900 |
Source: Public Records
Map
Nearby Homes
- 88 Highland St
- 143 Valley Crest Dr
- 89 Merriman Rd
- 38 Wheeler Rd
- 455 Brimfield Rd
- 268 Fox Hill Rd
- 0 Collier Rd
- 101 Collier Rd
- 72 Concord Dr
- 50 Concord Dr Unit 50
- 186 Hang Dog Ln
- 5 Robeth Ln
- 508 Highland St
- 155 Old Common Rd
- 25 Sutton Rd
- 119 Coleman Rd
- 195 Middletown Ave
- 108 Chamberlain Rd
- 104 Willow St
- 35 Stillwold Dr