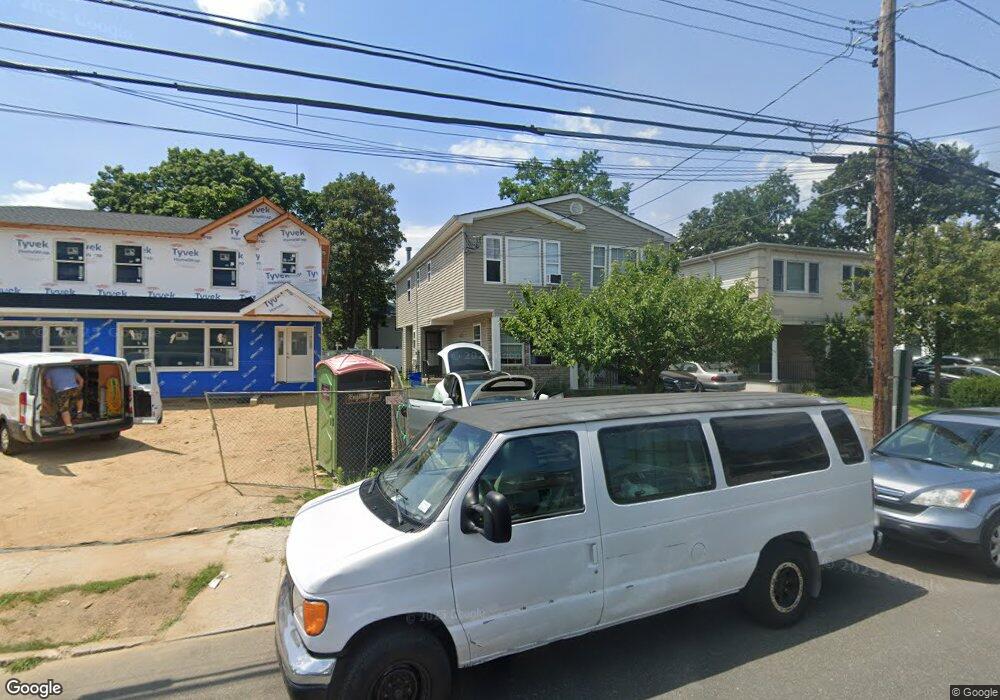
37 Dunwood Rd Port Washington, NY 11050
Estimated Value: $1,158,676 - $1,308,000
--
Bed
6
Baths
2,568
Sq Ft
$480/Sq Ft
Est. Value
About This Home
This home is located at 37 Dunwood Rd, Port Washington, NY 11050 and is currently estimated at $1,233,338, approximately $480 per square foot. 37 Dunwood Rd is a home located in Nassau County with nearby schools including Carrie Palmer Weber Middle School, Paul D. Schreiber Senior High School, and Happy Montessori School.
Ownership History
Date
Name
Owned For
Owner Type
Purchase Details
Closed on
Dec 17, 2021
Sold by
Zarabi Edward
Bought by
Kim Youngsook
Current Estimated Value
Home Financials for this Owner
Home Financials are based on the most recent Mortgage that was taken out on this home.
Original Mortgage
$588,750
Outstanding Balance
$541,568
Interest Rate
3.12%
Mortgage Type
New Conventional
Estimated Equity
$691,770
Purchase Details
Closed on
Sep 15, 2000
Sold by
Iannuci Vincent M
Bought by
Zarabi Daniel
Purchase Details
Closed on
Nov 22, 1999
Sold by
Iannucci Vincent M and Fornaro Nancy
Bought by
Iannucci Vincent M and Iannucci Margaret G
Purchase Details
Closed on
Aug 9, 1999
Sold by
Iannucci Vincent M and Iannucci Kathleen C
Bought by
Iannucci Vincent M and Fornaro Nancy
Purchase Details
Closed on
Oct 13, 1998
Purchase Details
Closed on
Dec 5, 1997
Purchase Details
Closed on
Oct 16, 1996
Create a Home Valuation Report for This Property
The Home Valuation Report is an in-depth analysis detailing your home's value as well as a comparison with similar homes in the area
Home Values in the Area
Average Home Value in this Area
Purchase History
| Date | Buyer | Sale Price | Title Company |
|---|---|---|---|
| Kim Youngsook | $785,000 | Westcor Land Title Ins Co | |
| Zarabi Daniel | $380,000 | Kenneth Golden | |
| Iannucci Vincent M | $140,000 | -- | |
| Iannucci Vincent M | -- | -- | |
| -- | -- | -- | |
| -- | -- | -- | |
| -- | -- | -- |
Source: Public Records
Mortgage History
| Date | Status | Borrower | Loan Amount |
|---|---|---|---|
| Open | Kim Youngsook | $588,750 |
Source: Public Records
Tax History Compared to Growth
Tax History
| Year | Tax Paid | Tax Assessment Tax Assessment Total Assessment is a certain percentage of the fair market value that is determined by local assessors to be the total taxable value of land and additions on the property. | Land | Improvement |
|---|---|---|---|---|
| 2025 | $18,121 | $903 | $303 | $600 |
| 2024 | $3,346 | $903 | $303 | $600 |
| 2023 | $16,402 | $957 | $340 | $617 |
| 2022 | $16,402 | $903 | $303 | $600 |
| 2021 | $13,742 | $990 | $332 | $658 |
| 2020 | $12,993 | $1,120 | $694 | $426 |
| 2019 | $13,210 | $1,200 | $698 | $502 |
| 2018 | $13,210 | $1,280 | $0 | $0 |
| 2017 | $10,414 | $1,360 | $573 | $787 |
| 2016 | $13,436 | $1,440 | $606 | $834 |
| 2015 | $3,754 | $1,767 | $744 | $1,023 |
| 2014 | $3,754 | $1,767 | $744 | $1,023 |
| 2013 | $3,580 | $1,767 | $744 | $1,023 |
Source: Public Records
Map
Nearby Homes
- 44 Firwood Rd
- 42 Firwood Rd Unit A
- 59 Edgewood Rd
- 68 Graywood Rd
- 78 Edgewood Rd
- 24 Hickory Rd
- 27 Juniper Rd
- 46 Linwood Rd N Unit A and B
- 46 Linwood Rd N
- 11 Fishermans Dr
- 130 Sands Point Rd
- 47 Marwood Rd N
- 36 Fishermans Dr
- 13 Linwood Rd S
- 14 Marwood Rd S
- 1 Orchard Beach Blvd
- 55 Driftwood Dr
- 13 Dunes Ln Unit A and B
- 13 Dunes Ln
- 10 Oldwood Rd
- 39 A Dunwood Rd
- 39 B Dunwood Rd
- 39 Dunwood Rd
- 35 Dunwood Rd
- 41 Dunwood Rd
- 40 Edgewood Rd
- 42 Edgewood Rd
- 42 Edgewood Rd Unit A
- 42 Edgewood Rd Unit B
- 42 Edgewood Rd
- 33 Dunwood Rd
- 46 Edgewood Rd
- 38 Edgewood Rd
- 45 Dunwood Rd
- 45 Dunwood Rd Unit B
- 36 Dunwood Rd
- 34 Dunwood Rd
- 34 Dunwood Rd Unit B
- 48 Edgewood Rd
- 36 Edgewood Rd