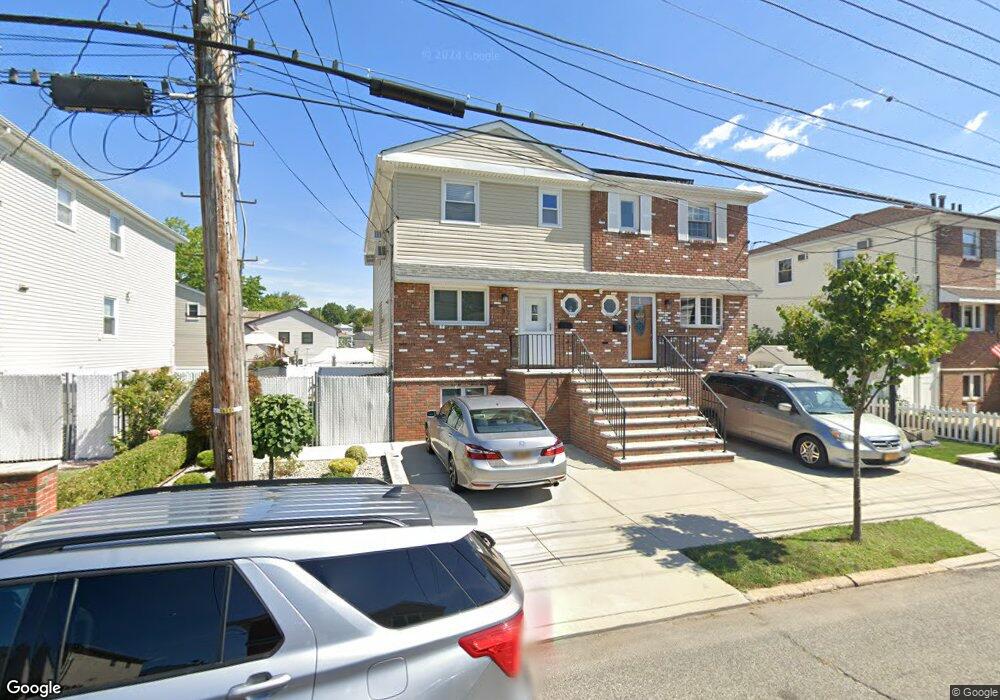
37 E Broadway Staten Island, NY 10306
Oakwood NeighborhoodEstimated Value: $651,779 - $816,000
Studio
--
Bath
2,040
Sq Ft
$352/Sq Ft
Est. Value
About This Home
This home is located at 37 E Broadway, Staten Island, NY 10306 and is currently estimated at $717,695, approximately $351 per square foot. 37 E Broadway is a home located in Richmond County with nearby schools including P.S. 23 Richmondtown, Myra S. Barnes Intermediate School 24, and New Dorp High School.
Ownership History
Date
Name
Owned For
Owner Type
Purchase Details
Closed on
Jun 22, 2011
Sold by
Markham Gardens Housing Development Fund
Bought by
Orellana Julio
Current Estimated Value
Home Financials for this Owner
Home Financials are based on the most recent Mortgage that was taken out on this home.
Original Mortgage
$217,681
Outstanding Balance
$151,744
Interest Rate
4.87%
Mortgage Type
FHA
Estimated Equity
$565,951
Purchase Details
Closed on
Jun 29, 2007
Sold by
New York City Housing Authority
Bought by
Markham Gardens Housing Development Fund and Markham Homes Lp
Create a Home Valuation Report for This Property
The Home Valuation Report is an in-depth analysis detailing your home's value as well as a comparison with similar homes in the area
Home Values in the Area
Average Home Value in this Area
Purchase History
| Date | Buyer | Sale Price | Title Company |
|---|---|---|---|
| Orellana Julio | $445,560 | None Available | |
| Markham Gardens Housing Development Fund | -- | None Available |
Source: Public Records
Mortgage History
| Date | Status | Borrower | Loan Amount |
|---|---|---|---|
| Open | Orellana Julio | $217,681 |
Source: Public Records
Tax History
| Year | Tax Paid | Tax Assessment Tax Assessment Total Assessment is a certain percentage of the fair market value that is determined by local assessors to be the total taxable value of land and additions on the property. | Land | Improvement |
|---|---|---|---|---|
| 2025 | $5,904 | $37,500 | $5,012 | $32,488 |
| 2024 | $5,904 | $30,660 | $6,097 | $24,563 |
| 2023 | $5,632 | $27,730 | $6,175 | $21,555 |
| 2022 | $5,222 | $26,160 | $6,360 | $19,800 |
| 2021 | $5,430 | $25,800 | $6,360 | $19,440 |
| 2020 | $5,212 | $28,500 | $6,360 | $22,140 |
| 2019 | $5,151 | $29,040 | $6,360 | $22,680 |
| 2018 | $4,933 | $24,201 | $5,141 | $19,060 |
| 2017 | $4,654 | $22,832 | $5,307 | $17,525 |
| 2016 | $4,306 | $21,540 | $6,360 | $15,180 |
| 2015 | $3,938 | $20,520 | $5,280 | $15,240 |
| 2014 | $3,938 | $20,520 | $5,280 | $15,240 |
Source: Public Records
Map
Nearby Homes
- 42 Amber St
- 56 Wolverine St
- 69 Cedarview Ave
- 103 Dalton Ave
- 223 Park St
- 132 Cedarview Ave
- 143 Wolverine St
- 110 Bishop St
- 45 Francine Ct Unit B
- 12 Clarence Place
- 160 Wolverine St
- 28 Peter Ave
- 61 Francine Ct Unit B
- 52A Francine Ct Unit 80A
- 26 Altoona Ave
- 61 Natick St
- 174 Barbara St
- 57 Joel Place
- 118 Guyon Ave Unit 122
- 122 Guyon Ave
Your Personal Tour Guide
Ask me questions while you tour the home.