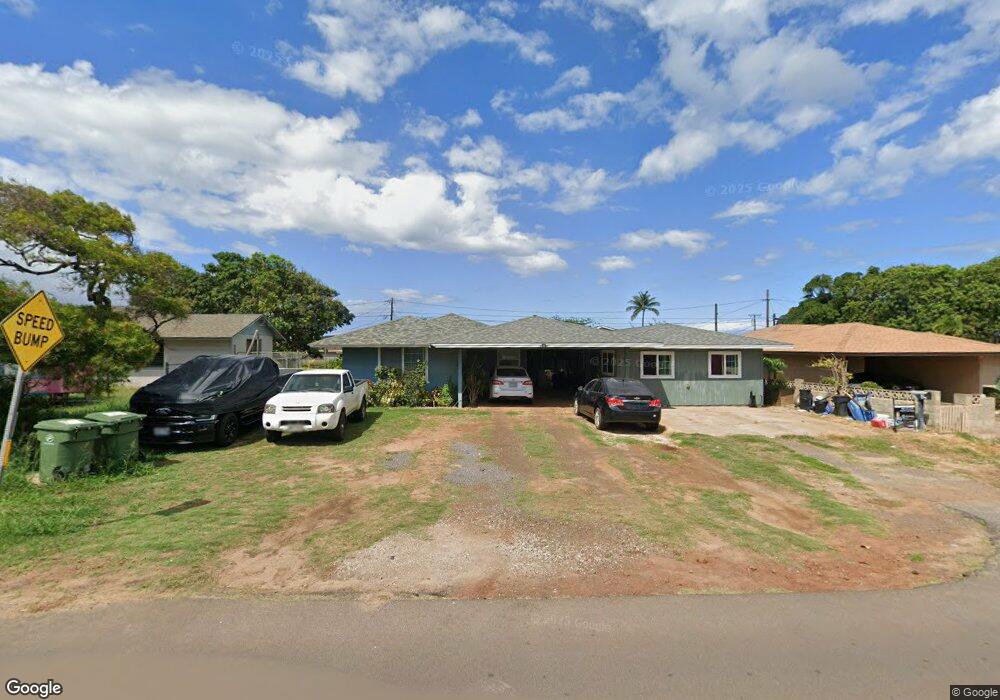
37 E Papa Ave Unit 114 Kahului, HI 96732
Estimated Value: $1,273,421 - $2,450,000
3
Beds
1
Bath
1,285
Sq Ft
$1,464/Sq Ft
Est. Value
About This Home
This home is located at 37 E Papa Ave Unit 114, Kahului, HI 96732 and is currently estimated at $1,881,105, approximately $1,463 per square foot. 37 E Papa Ave Unit 114 is a home located in Maui County with nearby schools including Kahului Elementary School, Maui Waena Intermediate School, and Maui High School.
Ownership History
Date
Name
Owned For
Owner Type
Purchase Details
Closed on
Oct 1, 2017
Sold by
Story Katherine A
Bought by
Ariota Frank and Ariota Bella R
Current Estimated Value
Purchase Details
Closed on
Dec 28, 2011
Sold by
Story Katherine A
Bought by
Story Katherine A and Revocable Living Trust Of Katherine A St
Purchase Details
Closed on
Nov 16, 2009
Sold by
Story Lynne L
Bought by
Story Katherine A
Purchase Details
Closed on
Jan 9, 2009
Sold by
Torres Clyde and Torres Peter
Bought by
Story Katherine A and Story Lynne L
Home Financials for this Owner
Home Financials are based on the most recent Mortgage that was taken out on this home.
Original Mortgage
$432,000
Interest Rate
5.49%
Mortgage Type
Unknown
Purchase Details
Closed on
Jun 4, 2008
Sold by
Torres Clyde
Bought by
Torres Clyde and Torres Peter
Purchase Details
Closed on
Oct 28, 2002
Sold by
Makekau Stanley N B and Makekau Stanley
Bought by
Makekau Jeffery N
Create a Home Valuation Report for This Property
The Home Valuation Report is an in-depth analysis detailing your home's value as well as a comparison with similar homes in the area
Home Values in the Area
Average Home Value in this Area
Purchase History
| Date | Buyer | Sale Price | Title Company |
|---|---|---|---|
| Ariota Frank | $610,000 | Fidelity Natl Title & Escrow | |
| Story Katherine A | -- | None Available | |
| Story Katherine A | -- | None Available | |
| Story Katherine A | $540,000 | Tg | |
| Torres Clyde | -- | None Available | |
| Makekau Jeffery N | -- | -- |
Source: Public Records
Mortgage History
| Date | Status | Borrower | Loan Amount |
|---|---|---|---|
| Previous Owner | Story Katherine A | $432,000 |
Source: Public Records
Tax History Compared to Growth
Tax History
| Year | Tax Paid | Tax Assessment Tax Assessment Total Assessment is a certain percentage of the fair market value that is determined by local assessors to be the total taxable value of land and additions on the property. | Land | Improvement |
|---|---|---|---|---|
| 2025 | $4,225 | $1,459,300 | $705,500 | $753,800 |
| 2024 | $4,225 | $1,358,400 | $638,800 | $719,600 |
| 2023 | $7,739 | $1,236,100 | $514,800 | $721,300 |
| 2022 | $6,670 | $1,102,500 | $448,100 | $654,400 |
| 2021 | $5,064 | $916,400 | $400,400 | $516,000 |
| 2020 | $3,606 | $661,600 | $457,600 | $204,000 |
| 2019 | $3,087 | $551,300 | $352,800 | $198,500 |
| 2018 | $2,571 | $465,700 | $305,100 | $160,600 |
| 2017 | $706 | $0 | $0 | $0 |
| 2016 | $582 | $415,600 | $267,000 | $148,600 |
| 2015 | $439 | $361,400 | $228,800 | $132,600 |
Source: Public Records
Map
Nearby Homes
- 37 E Papa Ave
- 412 S Puunene Ave
- 110 Aoloa Loop
- 138 Niihau St
- 145 W Kane St
- 94 Hoomoku Loop
- 111 Kahului Beach Rd Unit A315
- 111 Kahului Beach Rd Unit A104
- 111 Kahului Beach Rd Unit D 412
- 111 Kahului Beach Rd Unit D114
- 111 Kahului Beach Rd Unit C-409
- 111 Kahului Beach Rd Unit D410
- 111 Kahului Beach Rd Unit A127
- 111 Kahului Beach Rd Unit B112
- 111 Kahului Beach Rd Unit D221
- 111 Kahului Beach Rd Unit C213
- 111 Kahului Beach Rd Unit B-213
- 111 Kahului Beach Rd Unit D306
- 111 Kahului Beach Rd Unit D-321
- 111 Kahului Beach Rd Unit A426