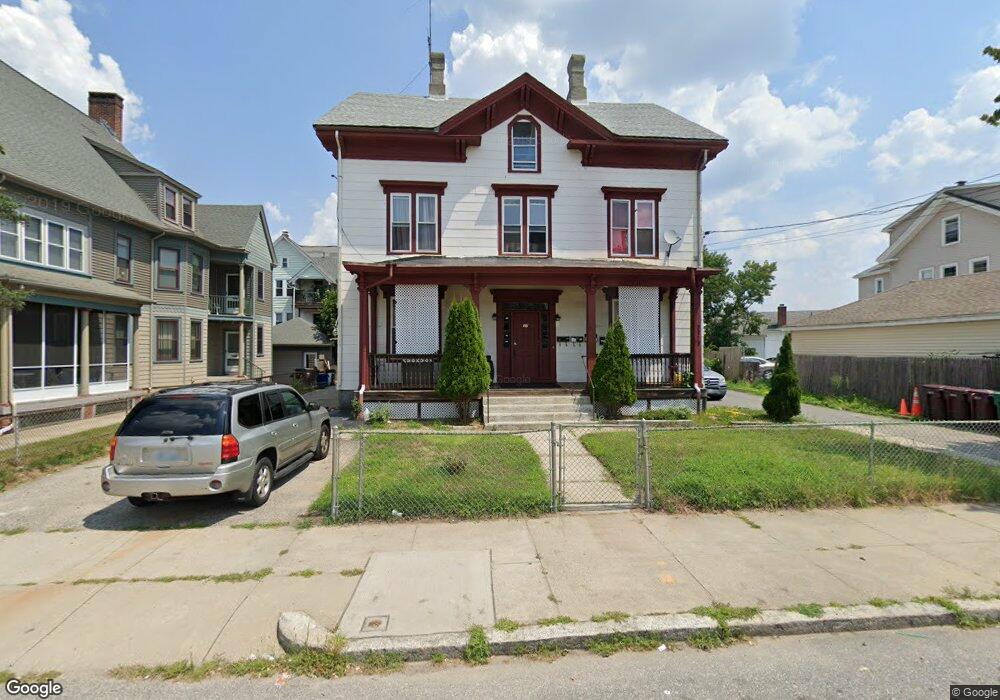
37 Earle St Woonsocket, RI 02895
Social District NeighborhoodEstimated Value: $368,718 - $546,000
5
Beds
3
Baths
2,888
Sq Ft
$162/Sq Ft
Est. Value
About This Home
This home is located at 37 Earle St, Woonsocket, RI 02895 and is currently estimated at $469,180, approximately $162 per square foot. 37 Earle St is a home located in Providence County with nearby schools including Woonsocket High School, Rise Prep Mayoral Academy Middle School, and Rise Prep Mayoral Academy.
Ownership History
Date
Name
Owned For
Owner Type
Purchase Details
Closed on
Jun 25, 2010
Sold by
Civil Process Svcs
Bought by
Kante Sooleymane
Current Estimated Value
Purchase Details
Closed on
Jul 3, 2002
Sold by
Degrange David A and Degrange Gregg A
Bought by
Aceves Fabio C
Home Financials for this Owner
Home Financials are based on the most recent Mortgage that was taken out on this home.
Original Mortgage
$133,898
Interest Rate
6.82%
Mortgage Type
Purchase Money Mortgage
Purchase Details
Closed on
Dec 10, 1999
Sold by
Morin Milford J
Bought by
Degrange David A and Blanchette Gregg A
Create a Home Valuation Report for This Property
The Home Valuation Report is an in-depth analysis detailing your home's value as well as a comparison with similar homes in the area
Home Values in the Area
Average Home Value in this Area
Purchase History
| Date | Buyer | Sale Price | Title Company |
|---|---|---|---|
| Kante Sooleymane | $3,864 | -- | |
| Kante Sooleymane | $3,864 | -- | |
| Aceves Fabio C | $136,000 | -- | |
| Aceves Fabio C | $136,000 | -- | |
| Degrange David A | $67,500 | -- | |
| Degrange David A | $67,500 | -- |
Source: Public Records
Mortgage History
| Date | Status | Borrower | Loan Amount |
|---|---|---|---|
| Previous Owner | Degrange David A | $292,500 | |
| Previous Owner | Degrange David A | $25,000 | |
| Previous Owner | Degrange David A | $133,898 |
Source: Public Records
Tax History
| Year | Tax Paid | Tax Assessment Tax Assessment Total Assessment is a certain percentage of the fair market value that is determined by local assessors to be the total taxable value of land and additions on the property. | Land | Improvement |
|---|---|---|---|---|
| 2025 | $5,372 | $478,400 | $89,500 | $388,900 |
| 2024 | $4,903 | $337,200 | $91,100 | $246,100 |
| 2023 | $4,714 | $337,200 | $91,100 | $246,100 |
| 2022 | $4,714 | $337,200 | $91,100 | $246,100 |
| 2021 | $3,978 | $167,500 | $37,100 | $130,400 |
| 2020 | $4,020 | $167,500 | $37,100 | $130,400 |
| 2018 | $4,033 | $167,500 | $37,100 | $130,400 |
| 2017 | $4,340 | $144,200 | $40,600 | $103,600 |
| 2016 | $4,591 | $144,200 | $40,600 | $103,600 |
| 2015 | $5,275 | $144,200 | $40,600 | $103,600 |
| 2014 | $5,064 | $140,900 | $44,800 | $96,100 |
Source: Public Records
Map
Nearby Homes
- 0 N Main St Unit 1401765
- 187 Boyden St
- 107 Blackstone St
- 130 E School St
- 115 Railroad St
- 83 Summer St
- 481 N Main St
- 180 Allen St Unit 104
- 35 Greene St
- 42 Elbow St
- 99 Allen St Unit 205
- 58 Oakley Rd
- 18 Villa Nova St
- 550 Winter St
- 142 Brook St
- 256 Privilege St
- 154 156 Winter St
- 752 Social St
- 685 Social St Unit 308
- 685 Social St Unit 313
Your Personal Tour Guide
Ask me questions while you tour the home.