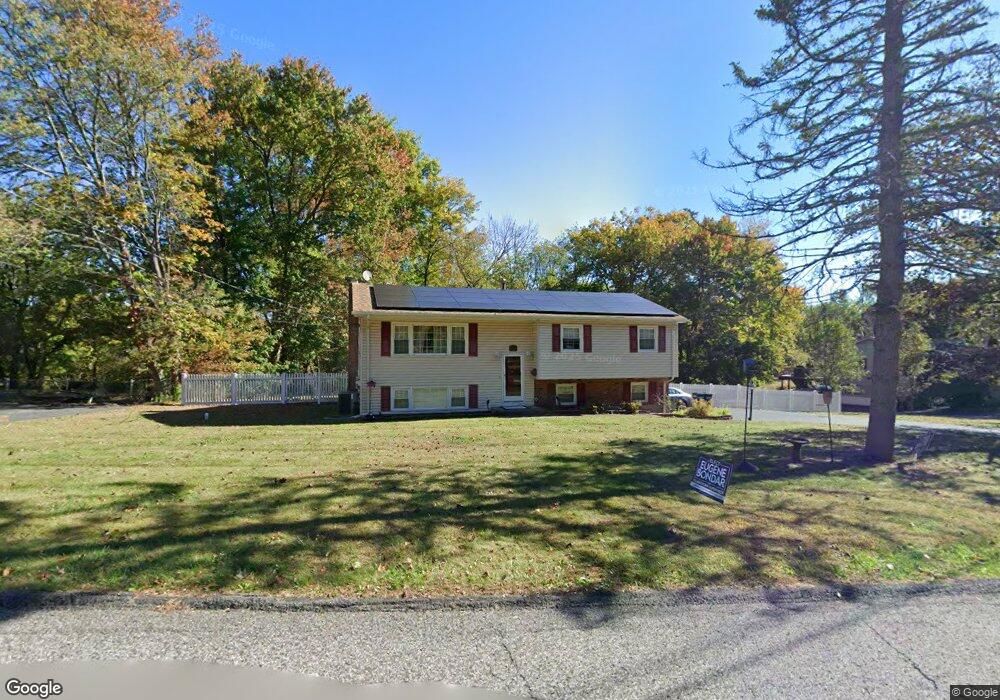
37 East St West Nyack, NY 10994
Estimated Value: $729,000 - $759,000
4
Beds
3
Baths
2,036
Sq Ft
$365/Sq Ft
Est. Value
About This Home
This home is located at 37 East St, West Nyack, NY 10994 and is currently estimated at $742,633, approximately $364 per square foot. 37 East St is a home located in Rockland County with nearby schools including West Nyack Elementary School, Felix Festa Middle School, and Clarkstown High School South.
Ownership History
Date
Name
Owned For
Owner Type
Purchase Details
Closed on
May 23, 2016
Sold by
Torricelli Vincent G and Torricelli Christine
Bought by
Robinson Christopher A and Robinson Kristin L
Current Estimated Value
Home Financials for this Owner
Home Financials are based on the most recent Mortgage that was taken out on this home.
Original Mortgage
$366,000
Outstanding Balance
$290,695
Interest Rate
3.59%
Mortgage Type
New Conventional
Estimated Equity
$451,938
Purchase Details
Closed on
Aug 4, 2011
Sold by
Desplantes Nancy Naomi
Bought by
Toricelli Vincent G
Create a Home Valuation Report for This Property
The Home Valuation Report is an in-depth analysis detailing your home's value as well as a comparison with similar homes in the area
Home Values in the Area
Average Home Value in this Area
Purchase History
| Date | Buyer | Sale Price | Title Company |
|---|---|---|---|
| Robinson Christopher A | $457,500 | Judicial Title | |
| Toricelli Vincent G | $485,000 | John Burke |
Source: Public Records
Mortgage History
| Date | Status | Borrower | Loan Amount |
|---|---|---|---|
| Open | Robinson Christopher A | $366,000 |
Source: Public Records
Tax History Compared to Growth
Tax History
| Year | Tax Paid | Tax Assessment Tax Assessment Total Assessment is a certain percentage of the fair market value that is determined by local assessors to be the total taxable value of land and additions on the property. | Land | Improvement |
|---|---|---|---|---|
| 2024 | $17,742 | $145,200 | $41,300 | $103,900 |
| 2023 | $17,742 | $145,200 | $41,300 | $103,900 |
| 2022 | $13,588 | $145,200 | $41,300 | $103,900 |
| 2021 | $13,588 | $145,200 | $41,300 | $103,900 |
| 2020 | $14,467 | $145,200 | $41,300 | $103,900 |
| 2019 | $13,946 | $145,200 | $41,300 | $103,900 |
| 2018 | $13,946 | $145,200 | $41,300 | $103,900 |
| 2017 | $13,592 | $145,200 | $41,300 | $103,900 |
| 2016 | $12,525 | $145,200 | $41,300 | $103,900 |
| 2015 | -- | $144,100 | $41,300 | $102,800 |
| 2014 | -- | $144,100 | $41,300 | $102,800 |
Source: Public Records
Map
Nearby Homes