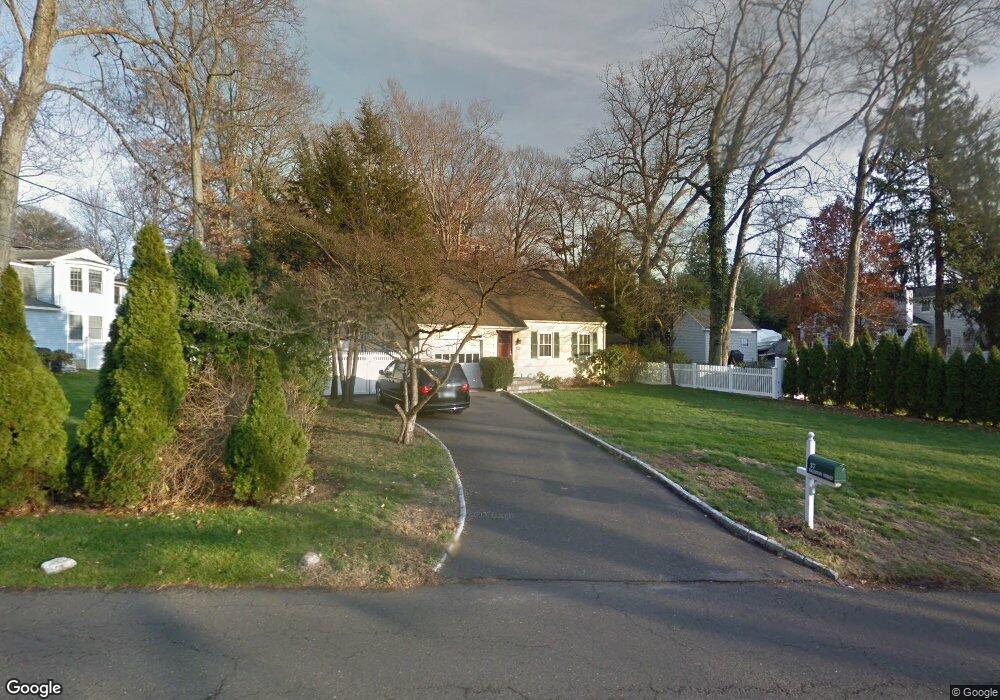
37 Edgerton St Darien, CT 06820
Estimated Value: $1,466,000 - $1,648,000
3
Beds
2
Baths
1,692
Sq Ft
$927/Sq Ft
Est. Value
About This Home
This home is located at 37 Edgerton St, Darien, CT 06820 and is currently estimated at $1,569,258, approximately $927 per square foot. 37 Edgerton St is a home located in Fairfield County with nearby schools including Royle Elementary School, Middlesex Middle School, and Darien High School.
Ownership History
Date
Name
Owned For
Owner Type
Purchase Details
Closed on
Dec 20, 2017
Sold by
Weihs Christopher
Bought by
Thompson Hilary and Thompson Philip
Current Estimated Value
Purchase Details
Closed on
Feb 19, 2008
Sold by
Metcalf Geoffrey E and Metcalf Kimberly C
Bought by
Liu Shichong and Li Liqun
Home Financials for this Owner
Home Financials are based on the most recent Mortgage that was taken out on this home.
Original Mortgage
$635,000
Interest Rate
6.14%
Purchase Details
Closed on
Feb 15, 2006
Sold by
Rogers Mary D
Bought by
Metcalf Geoffrey F and Metcalf Kimberly
Purchase Details
Closed on
Jun 20, 1995
Sold by
Melillo Mark and Melillo Susan
Bought by
Rogers Bruce and Rogers Mary
Purchase Details
Closed on
Jul 26, 1991
Sold by
Hudson John and Hudson Penny
Bought by
Melillo Mark and Melillo Susan
Purchase Details
Closed on
Aug 3, 1987
Sold by
Moore Stephen
Bought by
Hudson John
Create a Home Valuation Report for This Property
The Home Valuation Report is an in-depth analysis detailing your home's value as well as a comparison with similar homes in the area
Home Values in the Area
Average Home Value in this Area
Purchase History
| Date | Buyer | Sale Price | Title Company |
|---|---|---|---|
| Thompson Hilary | $847,500 | -- | |
| Liu Shichong | $910,000 | -- | |
| Metcalf Geoffrey F | $860,000 | -- | |
| Rogers Bruce | $390,000 | -- | |
| Melillo Mark | $340,000 | -- | |
| Hudson John | $380,000 | -- |
Source: Public Records
Mortgage History
| Date | Status | Borrower | Loan Amount |
|---|---|---|---|
| Previous Owner | Hudson John | $400,000 | |
| Previous Owner | Hudson John | $635,000 |
Source: Public Records
Tax History Compared to Growth
Tax History
| Year | Tax Paid | Tax Assessment Tax Assessment Total Assessment is a certain percentage of the fair market value that is determined by local assessors to be the total taxable value of land and additions on the property. | Land | Improvement |
|---|---|---|---|---|
| 2025 | $11,443 | $739,200 | $547,260 | $191,940 |
| 2024 | $10,859 | $739,200 | $547,260 | $191,940 |
| 2023 | $9,870 | $560,490 | $420,980 | $139,510 |
| 2022 | $9,657 | $560,490 | $420,980 | $139,510 |
| 2021 | $9,439 | $560,490 | $420,980 | $139,510 |
| 2020 | $9,170 | $560,490 | $420,980 | $139,510 |
| 2019 | $9,231 | $560,490 | $420,980 | $139,510 |
| 2018 | $8,284 | $515,200 | $371,770 | $143,430 |
| 2017 | $8,326 | $515,200 | $371,770 | $143,430 |
| 2016 | $8,125 | $515,200 | $371,770 | $143,430 |
| 2015 | $7,908 | $515,200 | $371,770 | $143,430 |
| 2014 | $7,733 | $515,200 | $371,770 | $143,430 |
Source: Public Records
Map
Nearby Homes
- 39 Noroton Ave
- 166 Hollow Tree Ridge Rd
- 311 Noroton Ave
- 19 William St
- 261 Hollow Tree Ridge Rd
- 77 Maple St
- 333 West Ave Unit 3
- 130 West Ave
- 128 West Ave
- 45 Hecker Ave
- 53 Noroton Ave
- 76 Deepwood Rd
- 10 Stony Brook Rd
- 98 Holmes Ave
- 47 Hollow Tree Ridge Rd
- 51 Hale Ln Unit 51
- 88 Maple Tree Ave Unit G
- 19 Anthony Ln
- 69 Maple Tree Ave Unit 4
- 90 Courtland Hill St