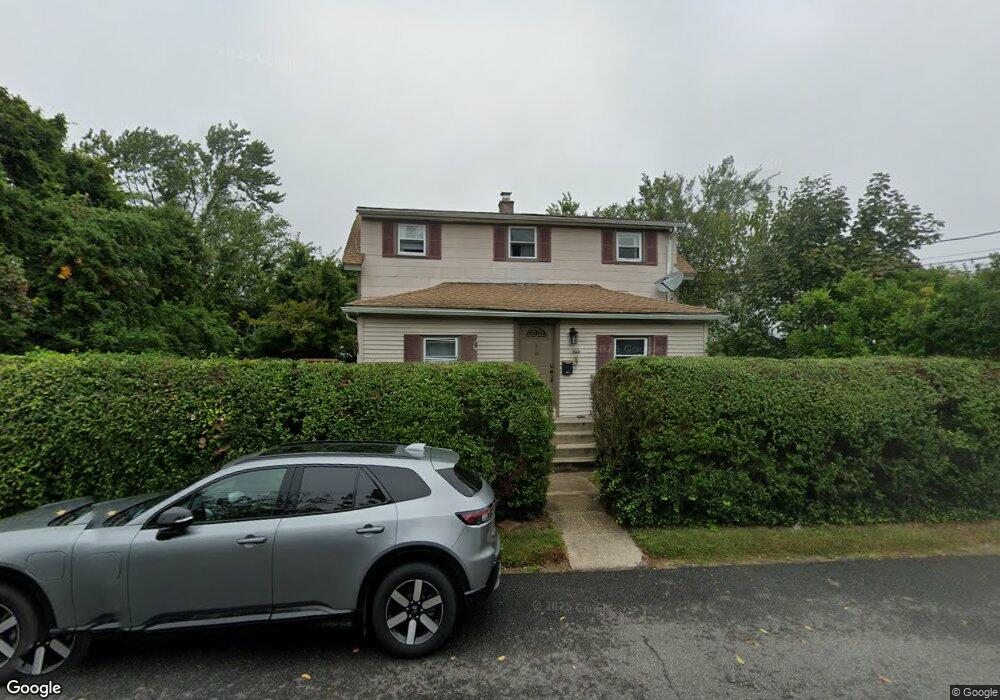
37 Garfield St Unit 1 Bay Shore, NY 11706
Estimated Value: $431,272 - $514,000
2
Beds
1
Bath
1,200
Sq Ft
$407/Sq Ft
Est. Value
About This Home
This home is located at 37 Garfield St Unit 1, Bay Shore, NY 11706 and is currently estimated at $488,318, approximately $406 per square foot. 37 Garfield St Unit 1 is a home located in Suffolk County with nearby schools including Fifth Avenue School, Gardiner Manor Elementary School, and Bay Shore Middle School.
Ownership History
Date
Name
Owned For
Owner Type
Purchase Details
Closed on
Jan 29, 2015
Sold by
Asner Laura
Bought by
Cla Family Holdings Four Llc
Current Estimated Value
Purchase Details
Closed on
Oct 28, 2011
Sold by
Cla Family Holdings Four Llc
Bought by
Asner Laura
Home Financials for this Owner
Home Financials are based on the most recent Mortgage that was taken out on this home.
Original Mortgage
$233,791
Interest Rate
4.09%
Mortgage Type
Purchase Money Mortgage
Create a Home Valuation Report for This Property
The Home Valuation Report is an in-depth analysis detailing your home's value as well as a comparison with similar homes in the area
Home Values in the Area
Average Home Value in this Area
Purchase History
| Date | Buyer | Sale Price | Title Company |
|---|---|---|---|
| Cla Family Holdings Four Llc | -- | None Available | |
| Asner Laura | -- | -- |
Source: Public Records
Mortgage History
| Date | Status | Borrower | Loan Amount |
|---|---|---|---|
| Previous Owner | Asner Laura | $233,791 |
Source: Public Records
Tax History Compared to Growth
Tax History
| Year | Tax Paid | Tax Assessment Tax Assessment Total Assessment is a certain percentage of the fair market value that is determined by local assessors to be the total taxable value of land and additions on the property. | Land | Improvement |
|---|---|---|---|---|
| 2024 | $8,535 | $25,300 | $6,100 | $19,200 |
| 2023 | $8,535 | $25,300 | $6,100 | $19,200 |
| 2022 | $7,964 | $25,300 | $6,100 | $19,200 |
| 2021 | $7,964 | $25,300 | $6,100 | $19,200 |
| 2020 | $8,316 | $25,300 | $6,100 | $19,200 |
| 2019 | $8,316 | $0 | $0 | $0 |
| 2018 | -- | $25,300 | $6,100 | $19,200 |
| 2017 | $7,977 | $25,300 | $6,100 | $19,200 |
| 2016 | $7,946 | $25,300 | $6,100 | $19,200 |
| 2015 | -- | $25,300 | $6,100 | $19,200 |
| 2014 | -- | $25,300 | $6,100 | $19,200 |
Source: Public Records
Map
Nearby Homes