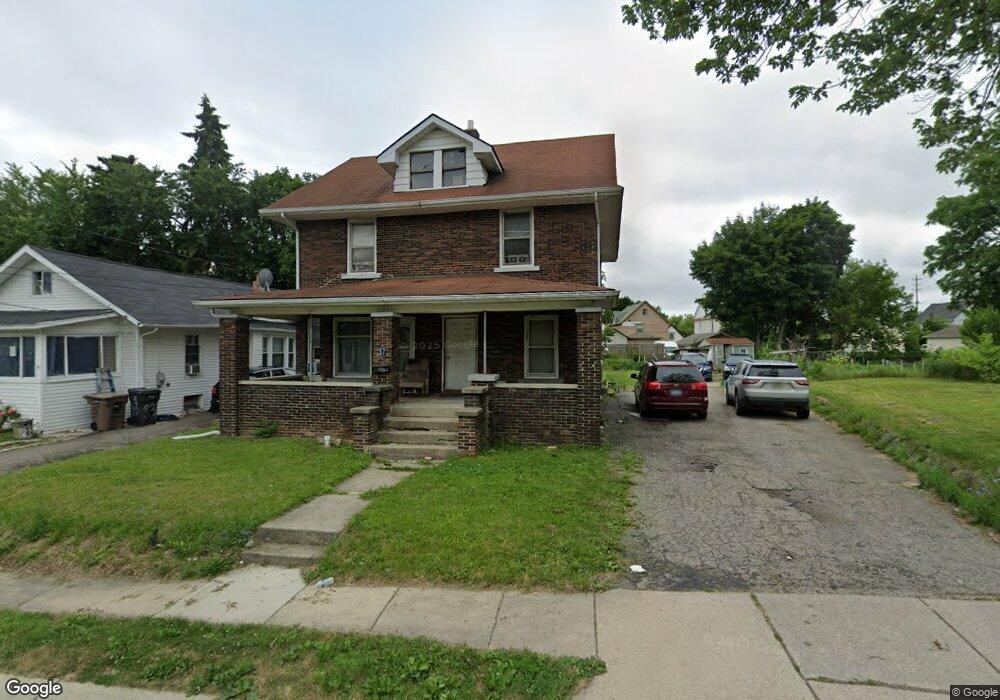
37 Gingell Ct Pontiac, MI 48342
Estimated Value: $110,000 - $194,000
4
Beds
1
Bath
1,744
Sq Ft
$77/Sq Ft
Est. Value
About This Home
This home is located at 37 Gingell Ct, Pontiac, MI 48342 and is currently estimated at $134,917, approximately $77 per square foot. 37 Gingell Ct is a home located in Oakland County with nearby schools including Owen Elementary School, Pontiac Middle School, and Pontiac High School.
Ownership History
Date
Name
Owned For
Owner Type
Purchase Details
Closed on
Aug 18, 2025
Sold by
Chang Phova X
Bought by
Mova Mary Pang-Nhia
Current Estimated Value
Purchase Details
Closed on
Jun 14, 2011
Sold by
Xiong Yer
Bought by
Chang Phoua X
Purchase Details
Closed on
Feb 13, 2009
Sold by
Xiong Sv K
Bought by
Xiong Yer
Purchase Details
Closed on
Mar 25, 2008
Sold by
Moua Choua Yang
Bought by
Xiong Sy K
Purchase Details
Closed on
Oct 12, 2004
Sold by
Xiong Sy K
Bought by
Maea Choua Yang
Purchase Details
Closed on
May 20, 2004
Sold by
Xiong Nhia K and Xiong Kia
Bought by
Xiong Say K and Xiong Sy K
Purchase Details
Closed on
Oct 12, 1995
Sold by
Spivy Gary L
Bought by
Xiong Nhia K
Home Financials for this Owner
Home Financials are based on the most recent Mortgage that was taken out on this home.
Original Mortgage
$27,300
Interest Rate
7.65%
Create a Home Valuation Report for This Property
The Home Valuation Report is an in-depth analysis detailing your home's value as well as a comparison with similar homes in the area
Home Values in the Area
Average Home Value in this Area
Purchase History
| Date | Buyer | Sale Price | Title Company |
|---|---|---|---|
| Mova Mary Pang-Nhia | -- | None Listed On Document | |
| Mova Mary Pang-Nhia | -- | None Listed On Document | |
| Chang Phoua X | -- | None Available | |
| Xiong Yer | -- | None Available | |
| Xiong Sy K | -- | None Available | |
| Maea Choua Yang | -- | -- | |
| Xiong Say K | -- | -- | |
| Xiong Nhia K | $39,000 | -- |
Source: Public Records
Mortgage History
| Date | Status | Borrower | Loan Amount |
|---|---|---|---|
| Previous Owner | Xiong Nhia K | $27,300 |
Source: Public Records
Tax History Compared to Growth
Tax History
| Year | Tax Paid | Tax Assessment Tax Assessment Total Assessment is a certain percentage of the fair market value that is determined by local assessors to be the total taxable value of land and additions on the property. | Land | Improvement |
|---|---|---|---|---|
| 2024 | $918 | $33,910 | $0 | $0 |
| 2023 | $875 | $30,220 | $0 | $0 |
| 2022 | $908 | $26,840 | $0 | $0 |
| 2021 | $882 | $23,900 | $0 | $0 |
| 2020 | $796 | $21,480 | $0 | $0 |
| 2019 | $848 | $18,500 | $0 | $0 |
| 2018 | $812 | $16,870 | $0 | $0 |
| 2017 | $781 | $16,430 | $0 | $0 |
| 2016 | $806 | $15,260 | $0 | $0 |
| 2015 | -- | $14,910 | $0 | $0 |
| 2014 | -- | $14,040 | $0 | $0 |
| 2011 | -- | $19,300 | $0 | $0 |
Source: Public Records
Map
Nearby Homes
- 431 Perry St
- 388 N Perry St
- 25 Elwood St
- 352 N Perry St
- 124 Kemp St
- 421 N Paddock St
- 217 Edison St
- 80 Oakhill St
- 52 Whitfield St
- 37 Poplar Ave
- 11 Lexington Place
- 36 Clairmont Place
- 633 N Perry St
- 73 Poplar Ave
- 100 Oliver St
- 669 N Perry St
- 130 Baldwin Ave
- 141 Oliver St
- 0 Baldwin Rd Unit 20251027987
- 0 Baldwin Ave Unit 20240055811