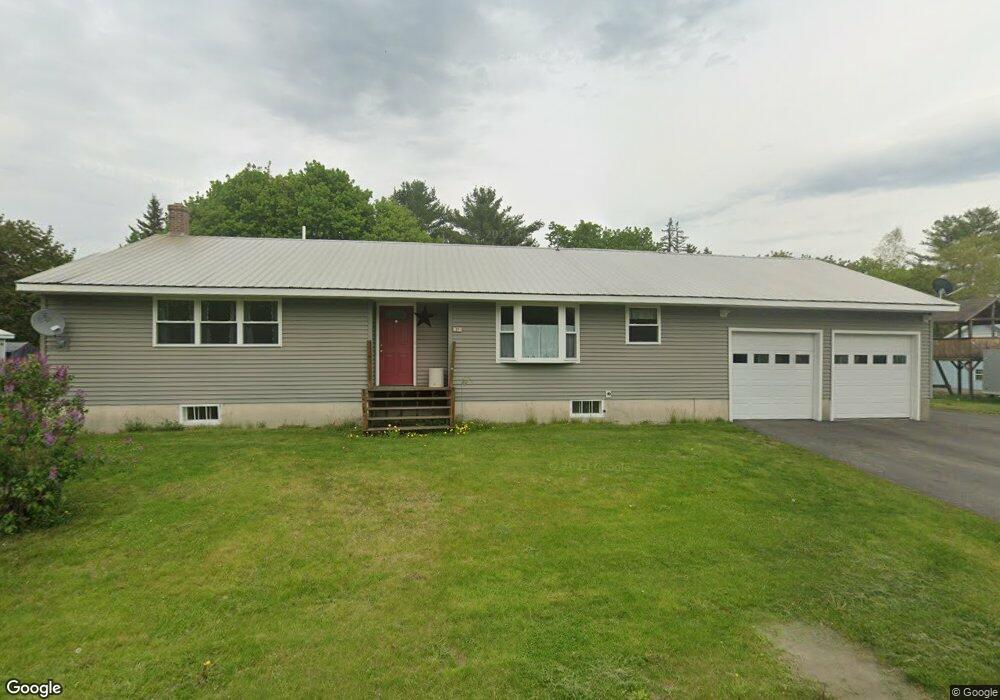
37 Hardy St Madison, ME 04950
Estimated Value: $233,000 - $265,000
4
Beds
2
Baths
1,500
Sq Ft
$163/Sq Ft
Est. Value
About This Home
This home is located at 37 Hardy St, Madison, ME 04950 and is currently estimated at $244,135, approximately $162 per square foot. 37 Hardy St is a home located in Somerset County with nearby schools including Madison Area Memorial High School.
Ownership History
Date
Name
Owned For
Owner Type
Purchase Details
Closed on
Nov 3, 2005
Sold by
Abbott Bruce D and Abbott Rebecca L
Bought by
Worster Timothy P and Worster Heather N
Current Estimated Value
Home Financials for this Owner
Home Financials are based on the most recent Mortgage that was taken out on this home.
Original Mortgage
$74,800
Interest Rate
5.85%
Mortgage Type
Commercial
Create a Home Valuation Report for This Property
The Home Valuation Report is an in-depth analysis detailing your home's value as well as a comparison with similar homes in the area
Home Values in the Area
Average Home Value in this Area
Purchase History
| Date | Buyer | Sale Price | Title Company |
|---|---|---|---|
| Worster Timothy P | -- | -- |
Source: Public Records
Mortgage History
| Date | Status | Borrower | Loan Amount |
|---|---|---|---|
| Previous Owner | Worster Timothy P | $74,800 |
Source: Public Records
Tax History Compared to Growth
Tax History
| Year | Tax Paid | Tax Assessment Tax Assessment Total Assessment is a certain percentage of the fair market value that is determined by local assessors to be the total taxable value of land and additions on the property. | Land | Improvement |
|---|---|---|---|---|
| 2024 | $2,679 | $166,400 | $35,300 | $131,100 |
| 2023 | $2,403 | $143,900 | $29,900 | $114,000 |
| 2022 | $2,169 | $116,700 | $24,000 | $92,700 |
| 2021 | $2,163 | $111,400 | $22,900 | $88,500 |
| 2020 | $2,280 | $107,300 | $22,900 | $84,400 |
| 2019 | $3,280 | $106,200 | $22,700 | $83,500 |
| 2018 | $133 | $106,200 | $22,700 | $83,500 |
| 2017 | $3,201 | $106,200 | $22,700 | $83,500 |
| 2016 | $2,230 | $106,200 | $22,700 | $83,500 |
| 2015 | $2,071 | $106,200 | $22,700 | $83,500 |
| 2014 | $2,071 | $106,200 | $22,700 | $83,500 |
| 2013 | $1,862 | $106,200 | $22,700 | $83,500 |
Source: Public Records
Map
Nearby Homes