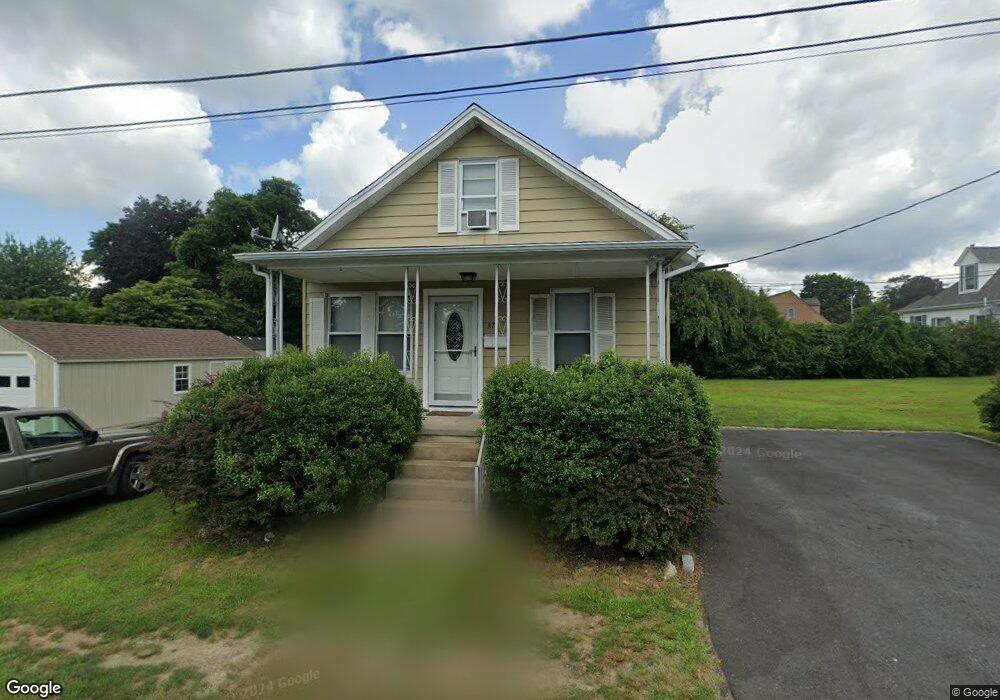
37 Hayes St Acushnet, MA 02743
Estimated Value: $351,000 - $391,000
3
Beds
1
Bath
1,168
Sq Ft
$323/Sq Ft
Est. Value
About This Home
This home is located at 37 Hayes St, Acushnet, MA 02743 and is currently estimated at $377,030, approximately $322 per square foot. 37 Hayes St is a home located in Bristol County with nearby schools including Acushnet Elementary School, Albert F Ford Middle School, and Alma Del Mar Charter School.
Ownership History
Date
Name
Owned For
Owner Type
Purchase Details
Closed on
May 9, 2024
Sold by
Dore Ronald J and Dore Donna M
Bought by
Dore Rt and Dore
Current Estimated Value
Purchase Details
Closed on
Oct 6, 2005
Sold by
Samagaio Helen R
Bought by
Dore Donna M and Dore Ronald J
Home Financials for this Owner
Home Financials are based on the most recent Mortgage that was taken out on this home.
Original Mortgage
$179,920
Interest Rate
5.81%
Mortgage Type
Purchase Money Mortgage
Create a Home Valuation Report for This Property
The Home Valuation Report is an in-depth analysis detailing your home's value as well as a comparison with similar homes in the area
Home Values in the Area
Average Home Value in this Area
Purchase History
| Date | Buyer | Sale Price | Title Company |
|---|---|---|---|
| Dore Rt | -- | None Available | |
| Dore Rt | -- | None Available | |
| Dore Donna M | $224,900 | -- | |
| Dore Donna M | $224,900 | -- |
Source: Public Records
Mortgage History
| Date | Status | Borrower | Loan Amount |
|---|---|---|---|
| Previous Owner | Dore Donna M | $165,300 | |
| Previous Owner | Dore Donna M | $179,920 |
Source: Public Records
Tax History Compared to Growth
Tax History
| Year | Tax Paid | Tax Assessment Tax Assessment Total Assessment is a certain percentage of the fair market value that is determined by local assessors to be the total taxable value of land and additions on the property. | Land | Improvement |
|---|---|---|---|---|
| 2025 | $32 | $297,400 | $99,200 | $198,200 |
| 2024 | $3,119 | $273,400 | $94,900 | $178,500 |
| 2023 | $2,941 | $245,100 | $86,300 | $158,800 |
| 2022 | $2,882 | $217,200 | $81,900 | $135,300 |
| 2021 | $2,712 | $196,100 | $81,900 | $114,200 |
| 2020 | $2,734 | $196,100 | $81,900 | $114,200 |
| 2019 | $2,630 | $185,500 | $86,200 | $99,300 |
| 2018 | $5,425 | $185,500 | $86,200 | $99,300 |
| 2017 | $2,520 | $174,500 | $86,200 | $88,300 |
| 2016 | $2,535 | $174,500 | $86,200 | $88,300 |
| 2015 | $2,405 | $168,400 | $86,200 | $82,200 |
Source: Public Records
Map
Nearby Homes